
Creating a social media marketing report seems tough, but it doesn’t have to be. A well-structured report shows what’s working, what’s not, and how your efforts are impacting growth. Whether you’re sharing results with clients, managers, or your own team, knowing exactly what to include and how to present it makes all the difference. In this blog, we’ll explain how to create a social media marketing report and the key elements that make it clear, useful, and easy to act on.
What Is a Social Media Marketing Report?
A social media marketing report is a structured document (or dashboard) that turns raw social data into clear, actionable insights. It shows how your campaigns perform, which content resonates, and whether your activity is driving real business results.
At its core, a social media marketing report does three things:
- Tracks performance over time: using metrics like engagement, reach, clicks, and conversions
- Compares against goals or benchmarks: showing whether you’re meeting expectations
- Provides insights & next steps: not just numbers, but meaning behind them
In other words, it’s not just about showing what happened, it’s about explaining why it happened and guiding future strategy.
Why Do You Need a Social Media Marketing Report?
A social media marketing report isn’t just about collecting numbers; it’s your guide into what’s working, what’s not, and where to go next. It turns data into direction.
Here are the core reasons it matters:
- Track ROI & justify efforts. You see how social campaigns impact traffic, leads, or sales, giving you proof you can show to stakeholders.
- Identify top-performing content. You’ll know which posts resonate most with your audience so you can replicate success.
- Understand your audience. Reports reveal behavior, preferences, and sentiment trends to guide your targeting.
- Optimize future strategy. Use evidence, not guesswork, to tweak content, timing, or ad spend.
- Maintain transparency. Whether for leadership or clients, a clear report builds trust and keeps everyone aligned.
How To Create a Social Media Marketing Report?
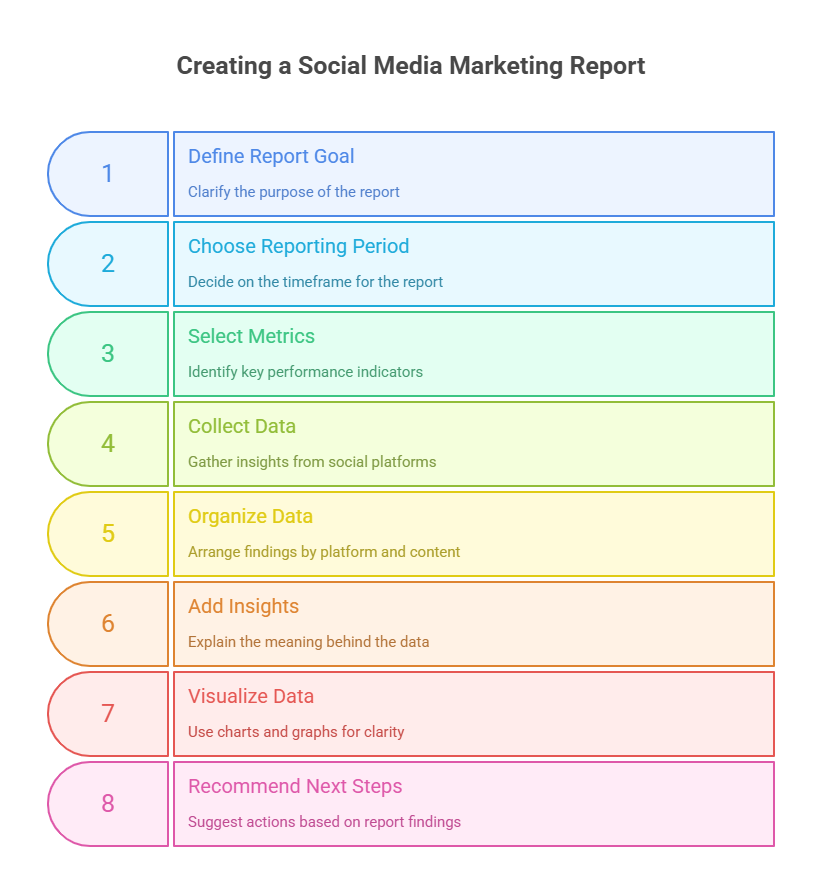
Creating a social media marketing report means turning raw data into a story your team or clients can act on. Follow these steps to build a report that’s both clear and impactful:
-
Define the Goal of the Report
Start by clarifying what you want the report to show. Is it to measure brand awareness, generate leads, or track conversions? A defined goal ensures your report stays focused and meaningful.
-
Choose a Reporting Period
Decide whether the report should cover a week, a month, or a specific campaign. Consistency in reporting periods makes it easier to compare performance over time.
-
Select the Right Metrics
Pick the metrics that connect directly to your goals. These might include engagement rate, reach, impressions, follower growth, click-through rate (CTR), or conversions.
-
Collect Data from Each Platform
Gather insights from all active platforms like Facebook, Instagram, LinkedIn, TikTok, and X (Twitter). This gives you a complete picture of your performance across channels.
Related Article: 4 Most Popular Social Media Platforms for Marketing Success
-
Organize Data Clearly
Arrange your findings by platform and content type. Breaking results into sections makes the report easier to digest and helps readers spot patterns quickly.
-
Add Insights
Numbers alone don’t tell the full story. Explain what the data means — why a campaign performed well, or why engagement dropped in a certain week. This context turns data into actionable insights.
-
Visualize Data
Charts, graphs, and infographics make reports easier to understand at a glance. A visual summary can highlight key wins or challenges without overwhelming the reader.
-
Recommend Next Steps
End your report with practical suggestions. For example, if video content performed better than images, recommend producing more videos in the next campaign.
What To Include in a Social Media Marketing Report?
Below are the core sections that make your social media report comprehensive and strategic. Each one adds value, not just numbers, but context, insights, and direction.
-
Executive Summary
Start with a concise overview: state the reporting period, the main highlights (wins and challenges), and the overall takeaway. This gives busy stakeholders a quick snapshot without diving into details.
-
Campaign Objectives
Outline the goals you set for this period or campaign, e.g., increase brand awareness, drive conversions, boost engagement. These objectives serve as the anchor for your metrics and analysis.
-
Methodology
Explain how data was collected: which tools you used, which platforms were included, what date ranges and filters apply. This transparency helps readers trust the report.
-
Social Media KPIs
List the key metrics you’re tracking that align with your goals, such as engagement rate, reach, impressions, follower growth, CTR, or conversion rate.
-
Platform-Specific Results (Facebook, Instagram, LinkedIn, X, TikTok)
Break down performance on each social channel. For example:
- How many new followers gained
- Engagement metrics per post
- Impressions/reach
- Clicks or conversions
This lets you see which platforms are driving results.
-
Content Performance Analysis
Dive into which posts, content formats, or topics worked best. Identify top-performing and underperforming content. Explain why some content resonated more than others.
Related Article: Content Marketing Analytics: Key to Know Your Audience
-
Audience Demographics & Insights
Show who your audience is (age, gender, location, interests) and how they engage. Also includes patterns or shifts in behavior that surfaced during this period.
-
Competitive Benchmarking
Compare your metrics with industry standards or direct competitors. This gives perspective: are you behind, ahead, or matching the market?
-
Opportunities & Challenges
Flag any issues or areas that didn’t go as expected, alongside possible opportunities you uncovered (e.g., new content themes, platforms, or audience segments).
-
Recommendations
Based on the data, suggest clear next steps for improvement: e.g., increase video content, adjust posting times, test new formats, or shift ad budgets.
-
Appendices (if needed)
Include supplementary materials like raw data tables, full post-level metrics, or extended charts that might be useful but are too detailed for the main report.
How to Set Up Social Media Reporting in ViewMetrics?
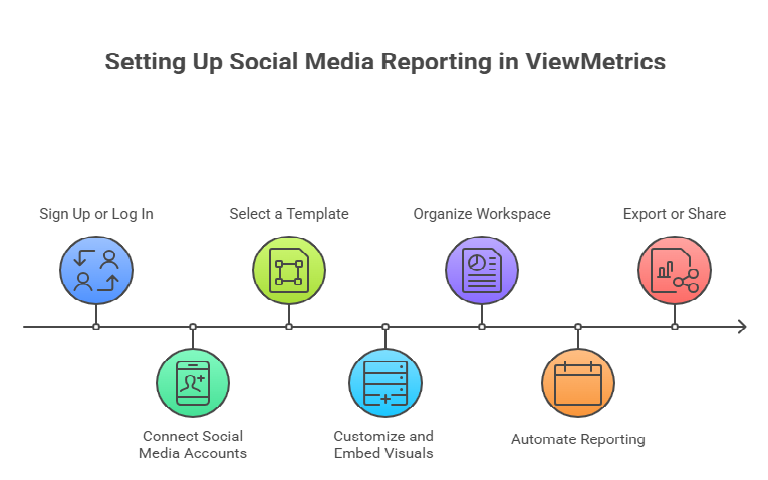
Getting started with ViewMetrics is quick and designed to make reporting effortless. Here’s how you can set up and streamline your social media reports step by step:
-
Sign Up or Log In
Head over to ViewMetrics and use the “Sign up” or “Log in” option to create or access your account.
-
Connect Your Social Media Accounts
From your dashboard, link your platforms such as Facebook, Instagram, LinkedIn, X (Twitter), or TikTok. ViewMetrics supports seamless integrations so your data flows in automatically.
-
Select a Template
Pick from ready-to-use templates like the Social Media Performance Overview or Content Performance Report. Choose one that matches your reporting needs, whether it’s tracking overall performance or breaking down content-specific metrics.
-
Customize and Embed Visuals
Use ViewMetrics’ integration with Google Sheets, Slides, Docs, or Looker Studio to embed dynamic charts, graphs, and visualizations. This makes your reports more engaging and easier to understand.
-
Organize Your Workspace
If you manage multiple clients or campaigns, the Workspace feature helps you keep everything organized. You can collaborate with your team and access all reports from one place.
-
Automate Your Reporting
Save time by scheduling recurring reports, weekly, monthly, or quarterly. ViewMetrics automatically updates your dashboards and visuals, ensuring your stakeholders always have the latest data.
-
Export or Share
When your report is ready, export it as a PDF, PowerPoint, or share it directly in presentations or live dashboards for easy access.
Best Practices for Creating a Social Media Marketing Report
-
Keep it concise
Don’t overwhelm readers with every metric imaginable. Stick to the ones that matter most for your goals.
-
Use visuals
Charts, graphs, and infographics help translate numbers into insight. A well-placed visual often speaks louder than a paragraph of text.
-
Customize for your audience
Tailor the level of detail based on who’s reading. Executives may want top-level takeaways; marketing teams will want deeper data and context.
-
Focus on impact
Always tie metrics back to business goals. Show how your social media efforts support awareness, leads, or conversions, not just vanity metrics.
A well-crafted social media marketing report goes beyond sharing metrics; it provides context, clarity, and direction. When you highlight the right data, present it in a clear format, and connect it to business goals, your reports become powerful tools for decision-making. Instead of treating reporting as a routine task, think of it as an opportunity to demonstrate value, uncover opportunities, and shape future strategies.
<VMCTA1 />
Frequently Asked Questions
How often should you create a social media marketing report?
The frequency depends on your goals and audience. Many businesses prepare monthly reports to get a steady view of overall performance. For short-term campaigns, a weekly report works better to monitor progress in real time. On the other hand, quarterly reports are useful for long-term trends and strategy reviews.
How long should a social media report be?
There’s no one-size-fits-all answer. If you’re sharing with executives, a 2–3-page summary highlighting key results and ROI is often enough. But if the report is for your marketing team, you may need a 10–15-page detailed version that includes platform breakdowns, audience insights, and content analysis.
Should I include paid ads performance in my report?
Absolutely. If you’re running paid campaigns, it’s important to include metrics like impressions, clicks, conversions, and ROI. Paid ads are part of your overall social media strategy, and leaving them out would give an incomplete picture of your efforts.
What’s the difference between a social media report and a social media audit?
A social media report is focused on a specific period (weekly, monthly, quarterly) and shows how your campaigns performed during that time. A social media audit, however, is a deep dive into all your accounts, content, and strategies to identify strengths, weaknesses, and opportunities for long-term improvement.
Should social media reports include qualitative data?
Yes. While numbers show reach, clicks, and engagement, qualitative data reveals how people actually feel about your brand. Adding community feedback, sentiment analysis, and recurring themes in comments helps you understand audience perception beyond the metrics.
How can I ensure my report is easy to understand?
Keep your language simple and avoid jargon. Provide quick explanations for any technical terms, and use charts, graphs, and visuals to make patterns easier to see. A clean layout with highlights and summaries also helps busy readers grasp the main takeaways quickly.
What is the difference between a social media report and an analytics dashboard?
A social media report is a polished, curated document that covers performance over a defined period and usually includes insights and recommendations. An analytics dashboard, on the other hand, is a real-time tool where you can track ongoing data as it happens. Think of the dashboard as your live feed and the report as your organized story of results.
Key Takeaways
- A social media marketing report turns raw data into actionable insights, showing performance, goals, and next steps.
- Reports help track ROI, spot high-performing content, understand audience behavior, and maintain transparency.
- To create one: set clear goals, choose a reporting period, pick the right metrics, collect and organize data, add insights, visualize results, and recommend improvements.
- Include essentials like an executive summary, objectives, methodology, KPIs, platform-specific results, content analysis, audience insights, benchmarking, opportunities, and recommendations.
- ViewMetrics simplifies reporting by automating data collection, integrating visuals, and enabling easy sharing.
- Best practices: keep reports concise, use visuals, tailor them to your audience, and focus on business impact.
Related Posts
-

Running a brand on social media can be challenging. Providing great customer service on online…
-

This guide will walk you through the different strategies you should use for posting across…
-

Summary for the Blog Email Marketing Reports provide a comprehensive view of campaign performance by…
-

There are many ways to generate leads on social media. 20% of business users have replaced…
-

Last week, we went over organic marketing tips. Now, it’s time to learn what you…