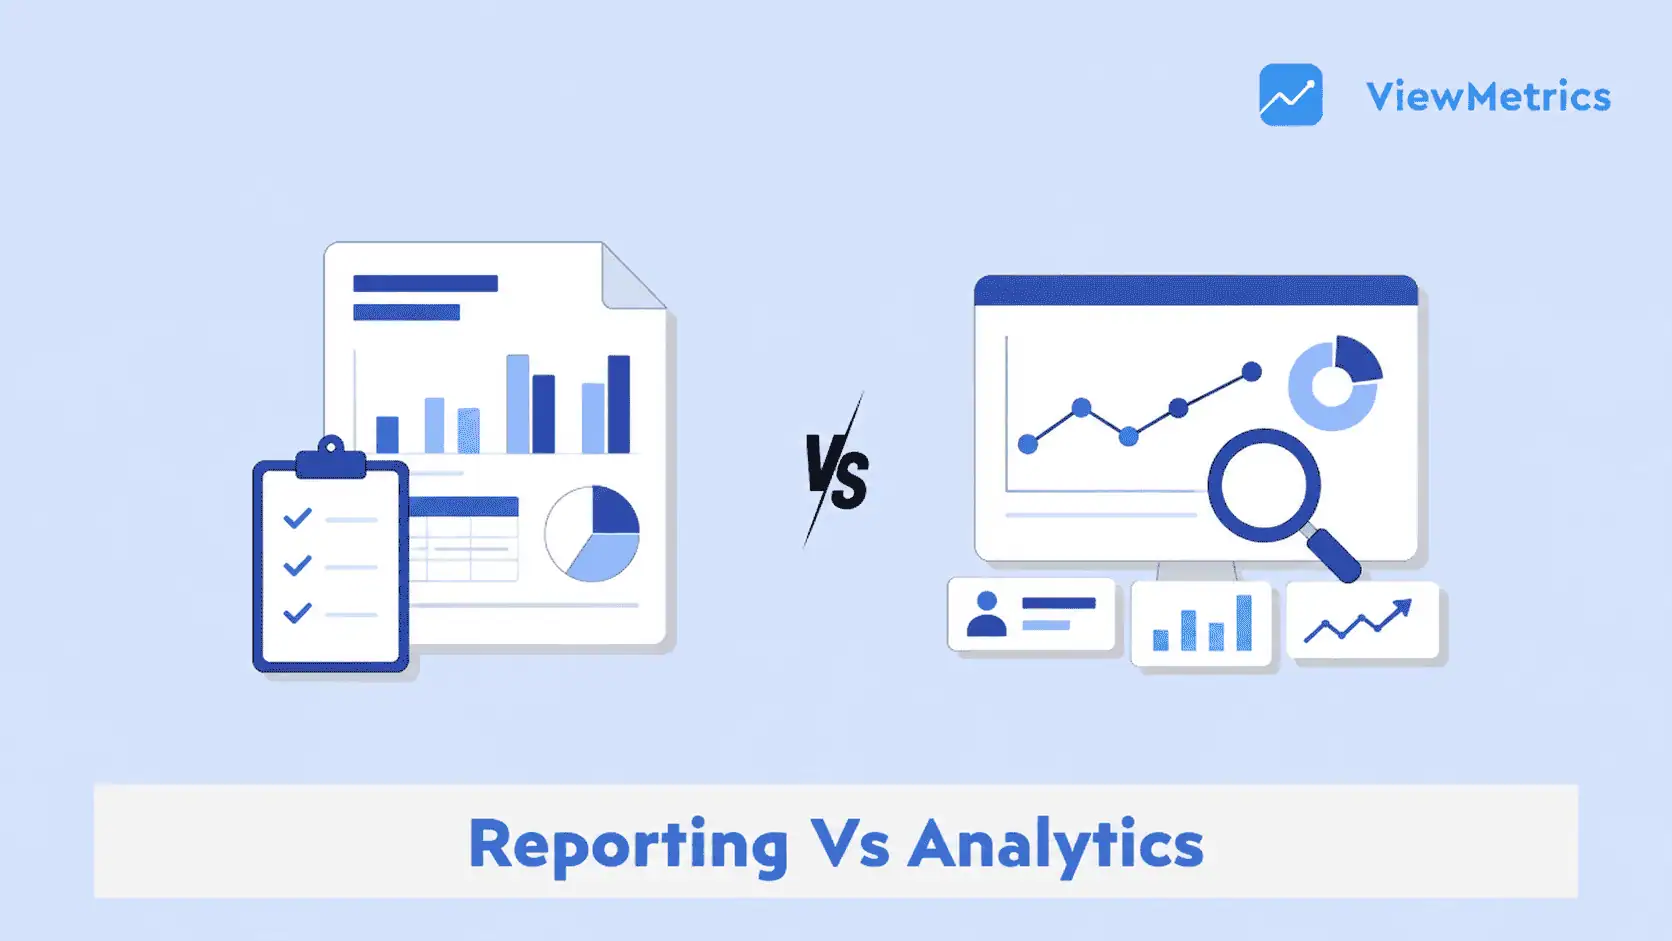
While both reporting and analytics deal with data, they serve very different purposes. Reporting highlights what has already happened, whereas analytics helps you understand the causes and decide your next steps.
This guide breaks down the difference, use cases, and how to use both effectively.
Reporting vs Analytics: What’s the Main Difference?
Reporting collects, organizes, and presents data in a structured format to show what has happened. On the other hand, analytics goes deeper by examining that data to uncover patterns, explain outcomes, and recommend actions.
In simple terms, reporting provides clarity, while analytics drives decisions.
What Is Reporting & What Are the Benefits?
Reporting focuses on collecting and presenting data in structured formats like dashboards, tables, and charts. This collected data then helps teams track performance and stay informed about ongoing activities.
Key Benefits of Reporting:
Reporting is essential for visibility and consistency in business operations. Here’s how it helps:
- Provides a clear view of performance: Reporting shows what happened by presenting metrics like traffic, revenue, or conversions in an easy-to-understand format.
- Helps track KPIs & business metrics: It allows teams to monitor important indicators regularly and stay aligned with their goals.
- Improves transparency & communication: Reports make it easier to share updates with stakeholders and keep everyone informed.
- Supports day-to-day monitoring: With the help of reports, teams can effortlessly track their ongoing performance and quickly identify any major changes.
- Ensures consistency in data presentation: Standardized reports help maintain uniformity across teams and clients.
Who uses it: Marketing managers, business teams, and stakeholders.
What Is Analytics & What Are the Benefits?
Analytics tells you more about what steps you can take by transforming collected data into actionable insights. It focuses on identifying patterns, trends, and insights. This deeper insight helps teams understand the reasons behind performance and make better decisions.
Key Benefits of Analytics:
Analytics goes beyond reporting by providing deeper insights and strategic direction:
- Provides deeper insights: Analytics explains why something happened instead of just showing the results.
- Helps forecast & predict trends: It uses data patterns to estimate future performance and outcomes.
- Supports strategic decision-making: Insights from analytics can help teams plan and optimize their campaigns effectively.
- Identifies opportunities & risks: It highlights areas for growth and potential challenges before they escalate.
- Improves business optimization: Analytics helps refine strategies for better performance and efficiency.
Who uses it: Data analysts, strategists, and leadership teams.
Quick Comparison: Reporting vs Analytics
| Aspect | Reporting | Analytics |
|---|---|---|
| Purpose | Shows what happened | Explains why it happened |
| Focus | Data presentation | Data interpretation |
| Output | Reports, dashboards | Insights, recommendations |
| Frequency | Regular (weekly, monthly, bi-monthly, quarterly) | As needed |
| Tools Used | Reporting tools, dashboards | Analytics tools, BI platforms |
| Skill Requirement | Basic understanding of metrics | Advanced analysis skills |
Detailed Comparison of Reports & Analytics
1. Purpose
Reporting: Reporting focuses on presenting performance data in a clear and structured format so teams can understand what has happened over a specific period.
Example: A monthly sales report may show a decline in revenue without explaining the cause.
Analytics: Analytics goes beyond reporting by examining data to identify patterns and reasons behind outcomes.
Example: A detailed analysis may reveal that the revenue decline happened due to underperforming channels and recommend optimizing ad spend.
2. Scope
Reporting: Reporting is limited to data visibility, as it organizes and displays metrics without deeper analysis.
Example: A dashboard may show traffic numbers from different sources without indicating which source performs best.
Analytics: Analytics has a broader scope because it interprets data to uncover insights and trends.
Example: It can identify which traffic source drives the highest conversions and predict future performance.
3. Output
Reporting: Reporting produces structured outputs such as dashboards, charts, and summaries that highlight key metrics.
Example: A weekly marketing report may show impressions, clicks, and conversions in a simple format.
Analytics: Analytics produces actionable insights that guide decision-making and strategy.
Example: A detailed analysis may suggest increasing the budget on a specific channel to improve ROI.
4. Users & Stakeholders
Reporting: Reporting is mainly used by marketing managers, business teams, and stakeholders who need a quick overview of performance.
Example: A marketing manager may review campaign KPIs to track progress.
Analytics: Analytics is typically used by data analysts, strategists, and leadership teams who need deeper insights for planning.
Example: An analyst may study trends and recommend changes to improve campaign performance.
5. Role in Decision-Making
Reporting: Reporting supports basic decision-making by providing a snapshot of performance data.
Example: It shows whether a campaign is performing well or not.
Analytics: Analytics plays a critical role in strategic decision-making by offering recommendations based on data insights.
Example: It helps decide which campaigns to scale, optimize, or pause.
6. Time Perspective
Reporting: Reporting focuses on historical data and past performance to provide context.
Example: It shows last month’s revenue or campaign results.
Analytics: Analytics focuses on both past and future data by using trends to predict outcomes.
Example: It can forecast next month’s revenue based on current metric patterns.
7. Value Provided
Reporting: Reporting provides clarity by presenting raw data in an organized way, helping teams stay informed.
Example: It shows that revenue reached a specific number during a campaign.
Analytics: Analytics provides value by turning data into insights that drive action and growth.
Example: It explains the reason revenue increased, such as paid ads, and recommends scaling that channel further.
When Should You Use Reporting vs Analytics?
When to Use Reporting (For Visibility & Tracking):
If you need a clear view of performance and want to consistently track your campaigns, reporting can help you with that. You can also use it to:
- Track KPIs and performance metrics
- Monitor day-to-day activities
- Use automated dashboards and scheduled reports
- Summarize past performance for stakeholders
- Compare results across campaigns or time periods
When to Use Analytics (For Insights & Decisions):
Analytics is useful when you need deeper insights and actionable recommendations. You can also use it to:
- Understand customer behavior and trends
- Identify root causes of performance changes
- Forecast future outcomes
- Find optimization opportunities
- Support strategic decision-making
Why Is ViewMetrics Ideal for Reporting & Analytics?
When it comes to managing both reporting and analytics, manually doing so can be extremely time-consuming and complex. ViewMetrics simplifies this by bringing everything into one platform.
- All-in-One Data Integration: ViewMetrics connects multiple data sources into one dashboard, so you can avoid switching between tools and get a complete view of performance.
- Automated Reporting: You can automate report creation and scheduling, reducing manual effort and improving consistency across clients and campaigns.
- Real-Time Dashboards & Insights: With real-time data updates, you can monitor performance instantly and respond quickly to changes.
- Customizable Reports & Templates: You can tailor dashboards and reports based on your business needs, ensuring clarity and relevance.
- Accurate & Seamless Data Sync: ViewMetrics ensures your data stays updated and accurate across all platforms, reducing errors.
- Collaboration & Client Access: Teams and clients can access reports easily, improving transparency and communication.
- Scalable for Growing Teams: Whether you manage a few campaigns or multiple clients, ViewMetrics scales with your needs.
- Actionable Insights: By combining reporting and analytics, ViewMetrics helps you move from data to decisions faster.
<VMCTA1 />
FAQs:
1. Which is better: reporting or analytics?
Neither of the options is “better” than the other because both reporting and analytics serve different purposes. Reporting shows what happened, while analytics explains why it happened. Both are essential for complete decision-making, so it really depends on your needs.
2. Can reporting exist without analytics?
Yes, reporting can exist independently, but it provides limited value without analytics to interpret the data and guide decisions.
3. Why is analytics important for business?
Analytics helps businesses understand trends, predict outcomes, and make informed decisions based on proper data insights.
4. Who uses reporting and analytics?
Reporting is used by managers and stakeholders, while analytics is mostly used by data and marketing analysts and strategists for deeper insights.
5. How often should reporting and analytics be used?
Reporting is used regularly, such as weekly or monthly, while analytics is used as needed for deeper analysis and strategy.
6. Do reporting tools include analytics features?
Some tools, like ViewMetrics, combine both reporting and analytics, allowing teams to track data and generate insights in one platform.
Related Posts
-
Tracking digital marketing performance across multiple platforms can be time-consuming and confusing. Jumping between Google…
-

If you’re using LinkedIn to grow your presence or promote your business, keeping track of…
-

Discover how data blending enhances business insights by merging data from various sources, improving decision-making,…
-

If you have a website, you need to use Google Analytics! Google Analytics can help…
-

With the help of digital analytics, businesses can better understand their product data, customer behavior,…