
Summary for the Blog
- LinkedIn Analytics is the platform’s data tools for tracking post and profile performance, including page views, engagement, and follower demographics, with business pages offering more detailed insights.
- Exporting LinkedIn analytics to CSV or Excel allows for in-depth analysis, improving lead generation, market research, and data-backed decision-making.
- Data can be manually exported from LinkedIn Page admin view by navigating to “Analytics,” selecting a section (Visitors, Content, Followers, Competitors, or Leads), and clicking “Export” for a chosen date range.
- LinkedIn provides various analytics categories, including Visitor, Content, Follower, Competitor, Leads, and Employee Advocacy Analytics.
If you’re using LinkedIn to grow your presence or promote your business, keeping track of your performance is really important. That’s where LinkedIn analytics come in. These insights help you understand what’s working, what’s not, and how people are engaging with your content. While LinkedIn gives you basic analytics through its platform, exporting this data into a CSV or Excel file gives you more freedom. It lets you explore the numbers in detail, build reports, and track your performance in a more organized way.
In this guide, we’ll show you how to export data from LinkedIn analytics to Excel easily. Without waiting further, let’s get started.
What are LinkedIn Analytics?
LinkedIn Analytics are built-in tools that show how your posts, profile, and audience are performing. You can track who’s viewing your page, how people engage with your content, and where your followers come from. Analytics work slightly differently for personal profiles and business pages, but you can access both if you manage a company presence. Even personal profiles now get full analytics access without needing Creator Mode. Whether you’re growing a brand or your own presence, LinkedIn gives you clear insights to measure your content’s impact.
How to Export Data from LinkedIn Analytics to Excel?
Want to save your LinkedIn data in an Excel file? Here’s how you can do it:
- Go to your LinkedIn Page admin view.
- From the left-hand menu, click on Analytics.
- Choose the section you want to export. It can be Visitors, Content, Followers, Competitors, or Leads.
- Once you’re there, click the Export button in the upper-right corner.
- Select the date range you need and click Export again.
- Your report will be downloaded as an Excel (XLS) file, which you can open and analyze anytime.
This is useful if you prefer working with data manually or want to share it in spreadsheet format.
How to Create LinkedIn Reports with ViewMetrics?
If you’re tired of exporting data manually every time you need a report, you can switch to an easier method. ViewMetrics lets you connect your LinkedIn page and automatically generate reports with your data. Here’s how you can set it up:
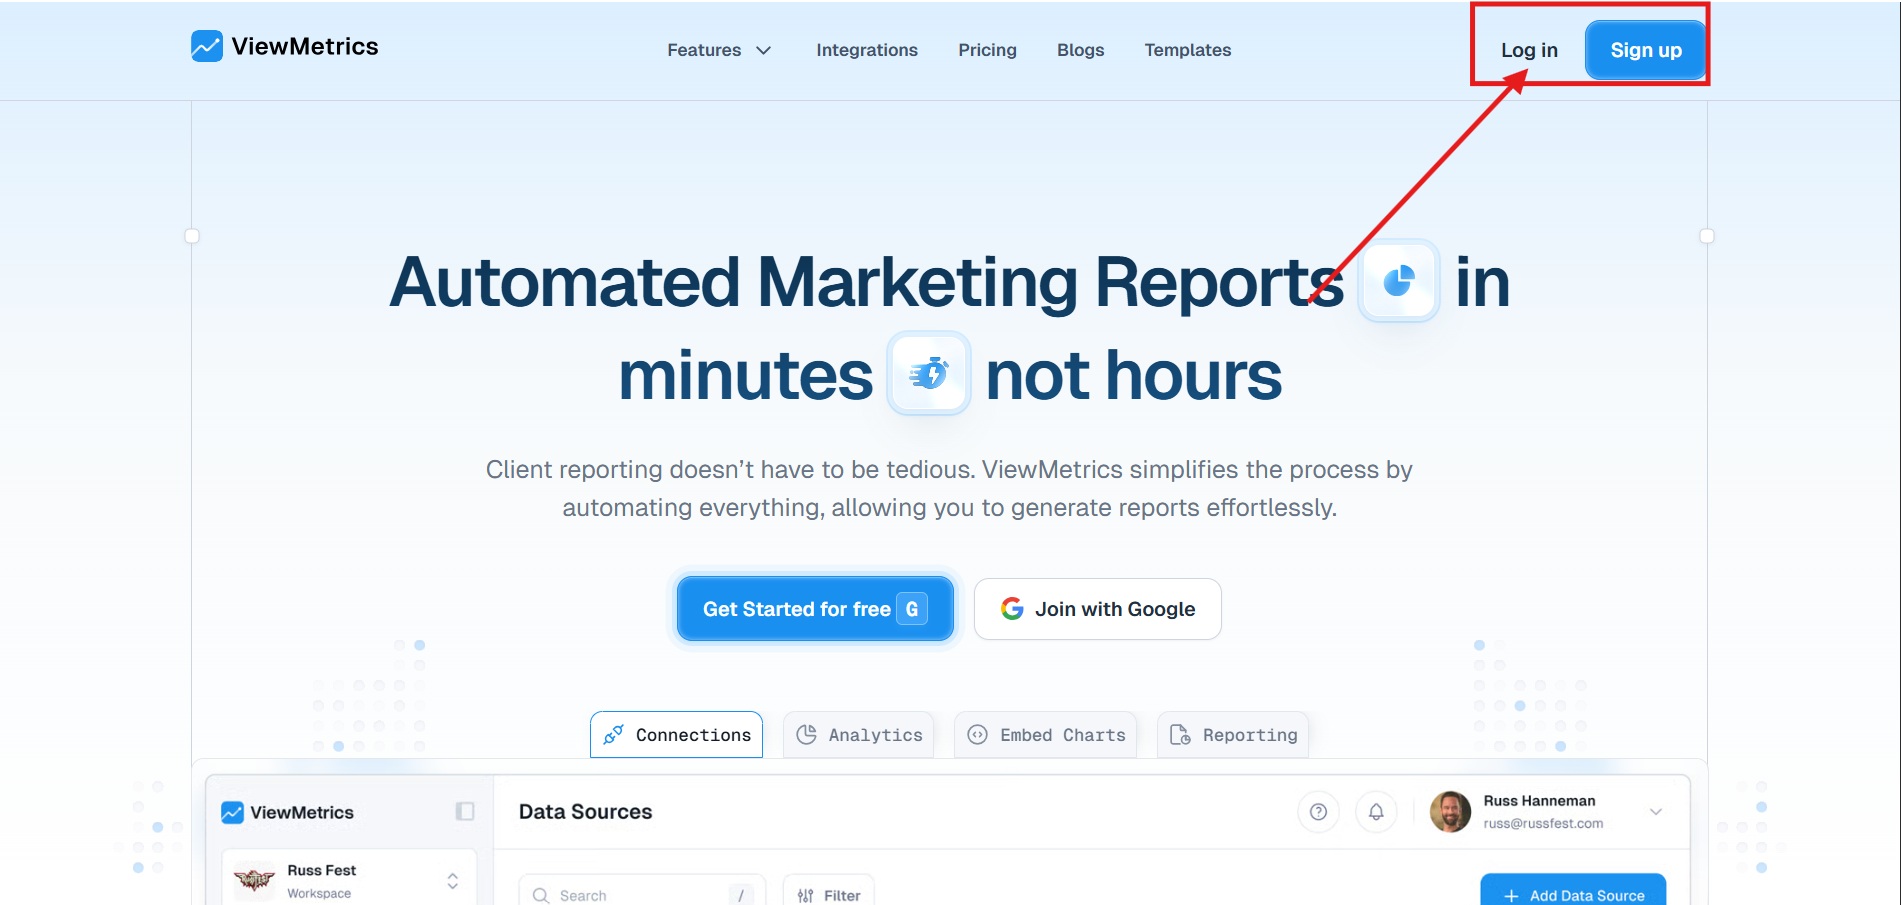
Step 1: Create or Log In to Your ViewMetrics Account
Go to ViewMetrics and sign up for an account. If you already have one, just log in.
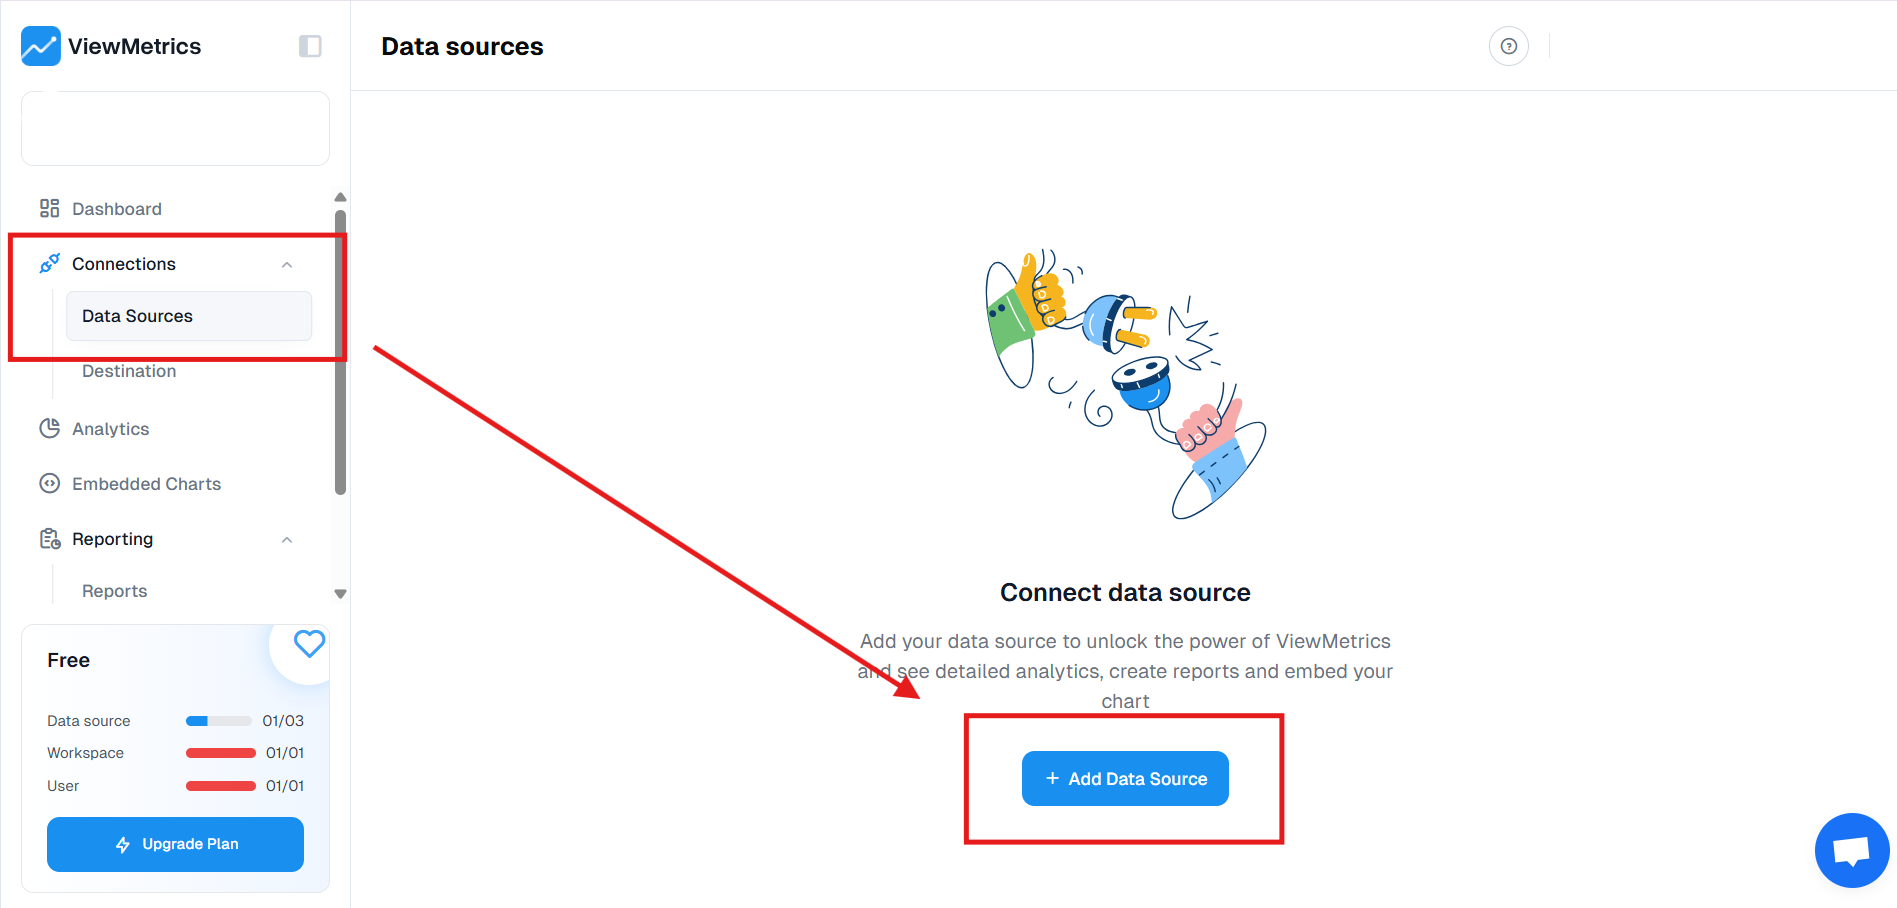
Step 2: Connect Your LinkedIn Business Page
Inside the dashboard, look for the data source section. Click on Connect Data Source and choose LinkedIn. Follow the prompts to link your business page securely.
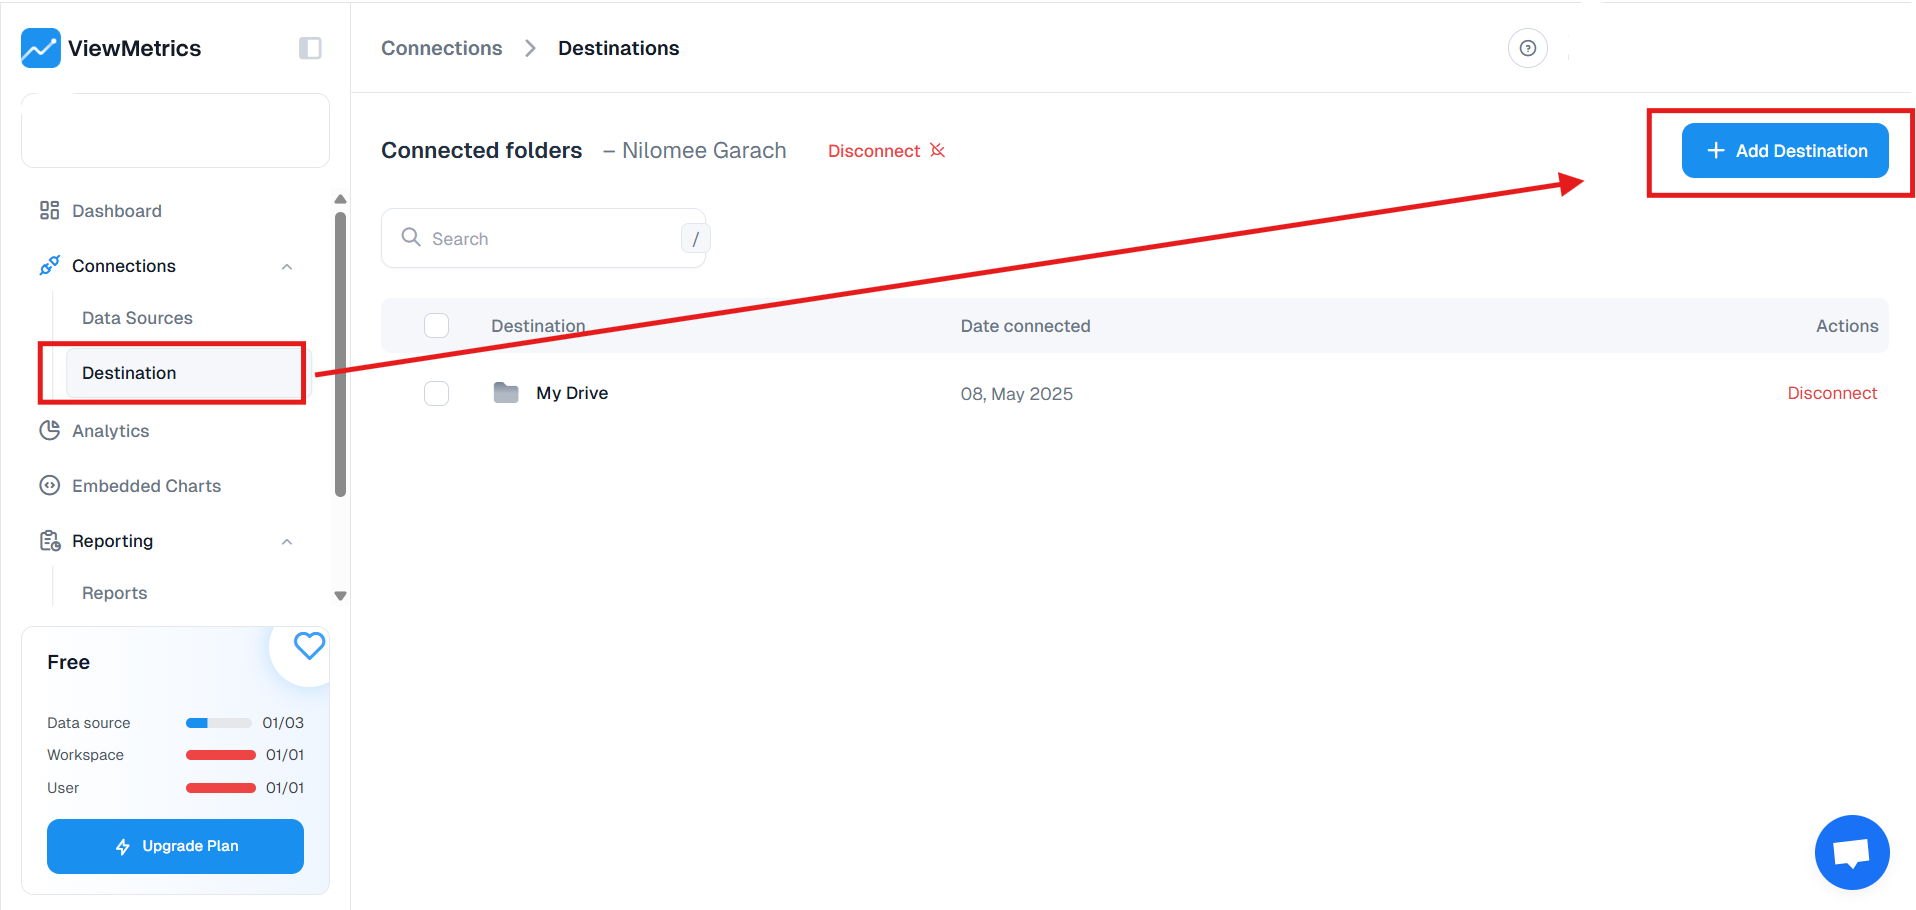
Step 3: Link Your Google Drive
This helps you store and access your reports directly in your Google Drive. Once linked, ViewMetrics can save your reports there automatically.
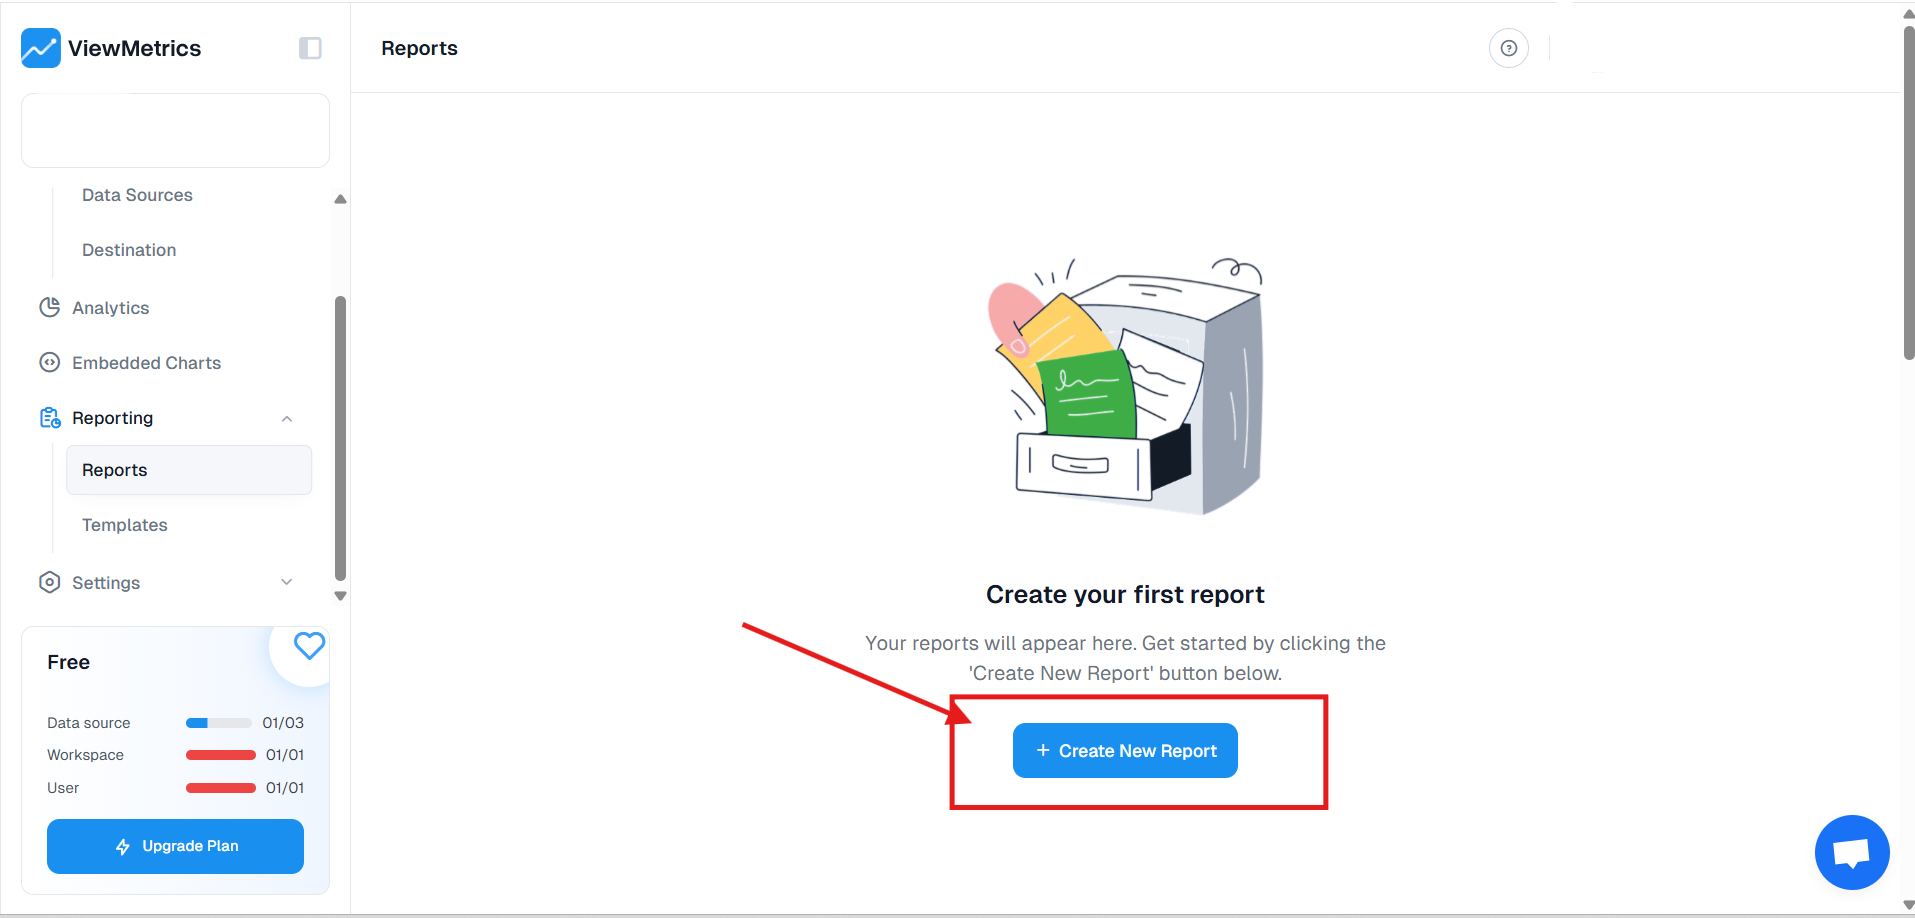
Step 4: Create a New Report
Go to the reports section and click on Create New Report. Choose the LinkedIn Report Template from the available options.
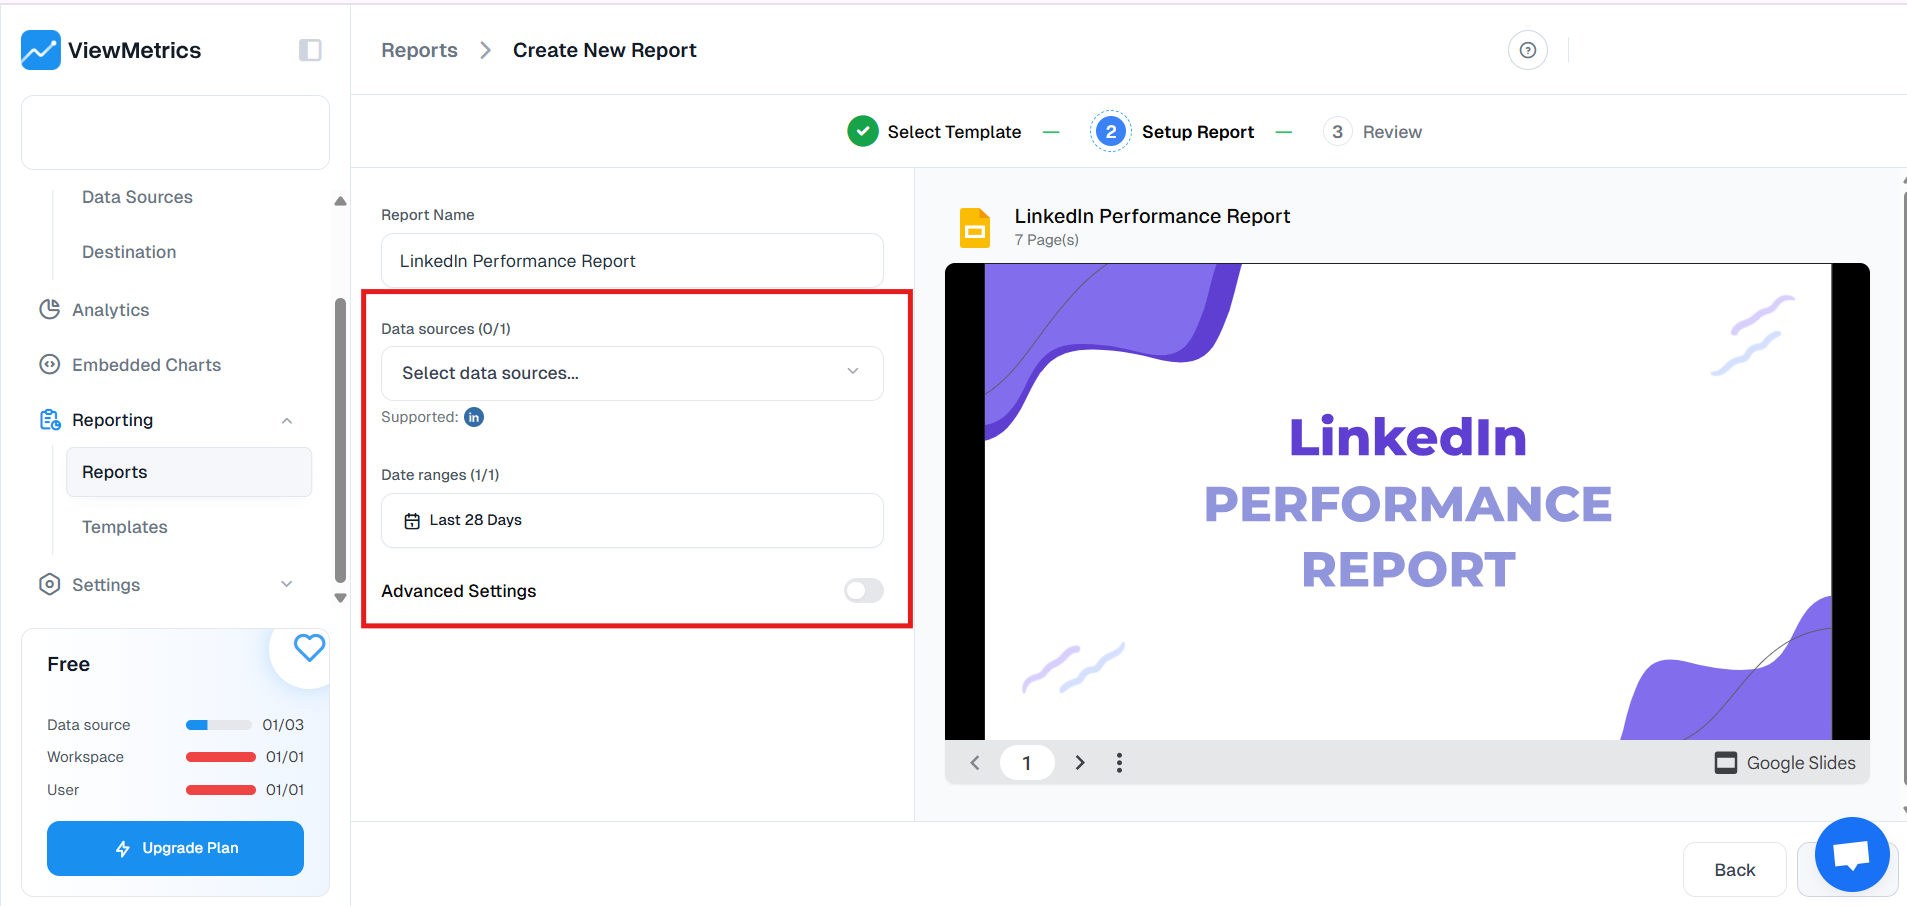
Step 5: Choose Your Data Source and Time Range
Select your LinkedIn business page from the list and then choose the date range for your report. This could be the last 7 days, 30 days, or a custom timeframe.
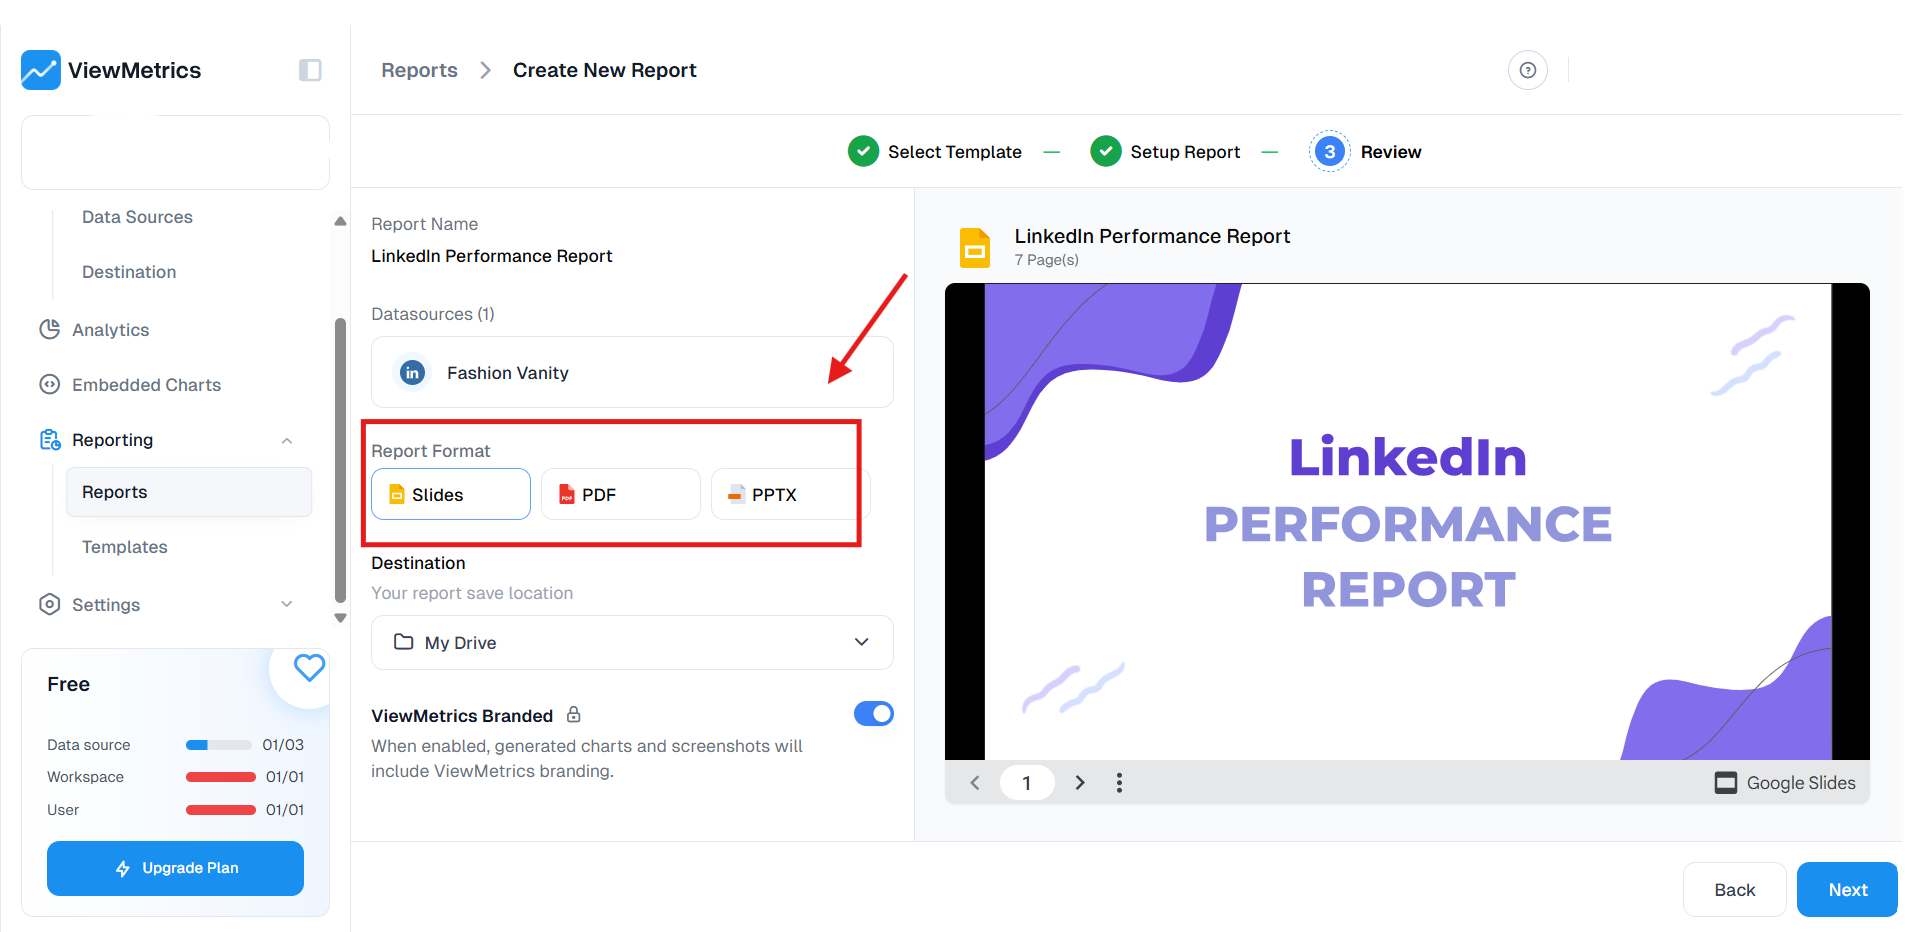
Step 6: Pick Your Report Format
Decide how you want your report to look. You can choose between PDF, Excel, or presentation-ready formats depending on what works best for you or your team, and then hit the Create Report button. ViewMetrics will gather all your LinkedIn analytics and generate a clean, structured report in just a few minutes.
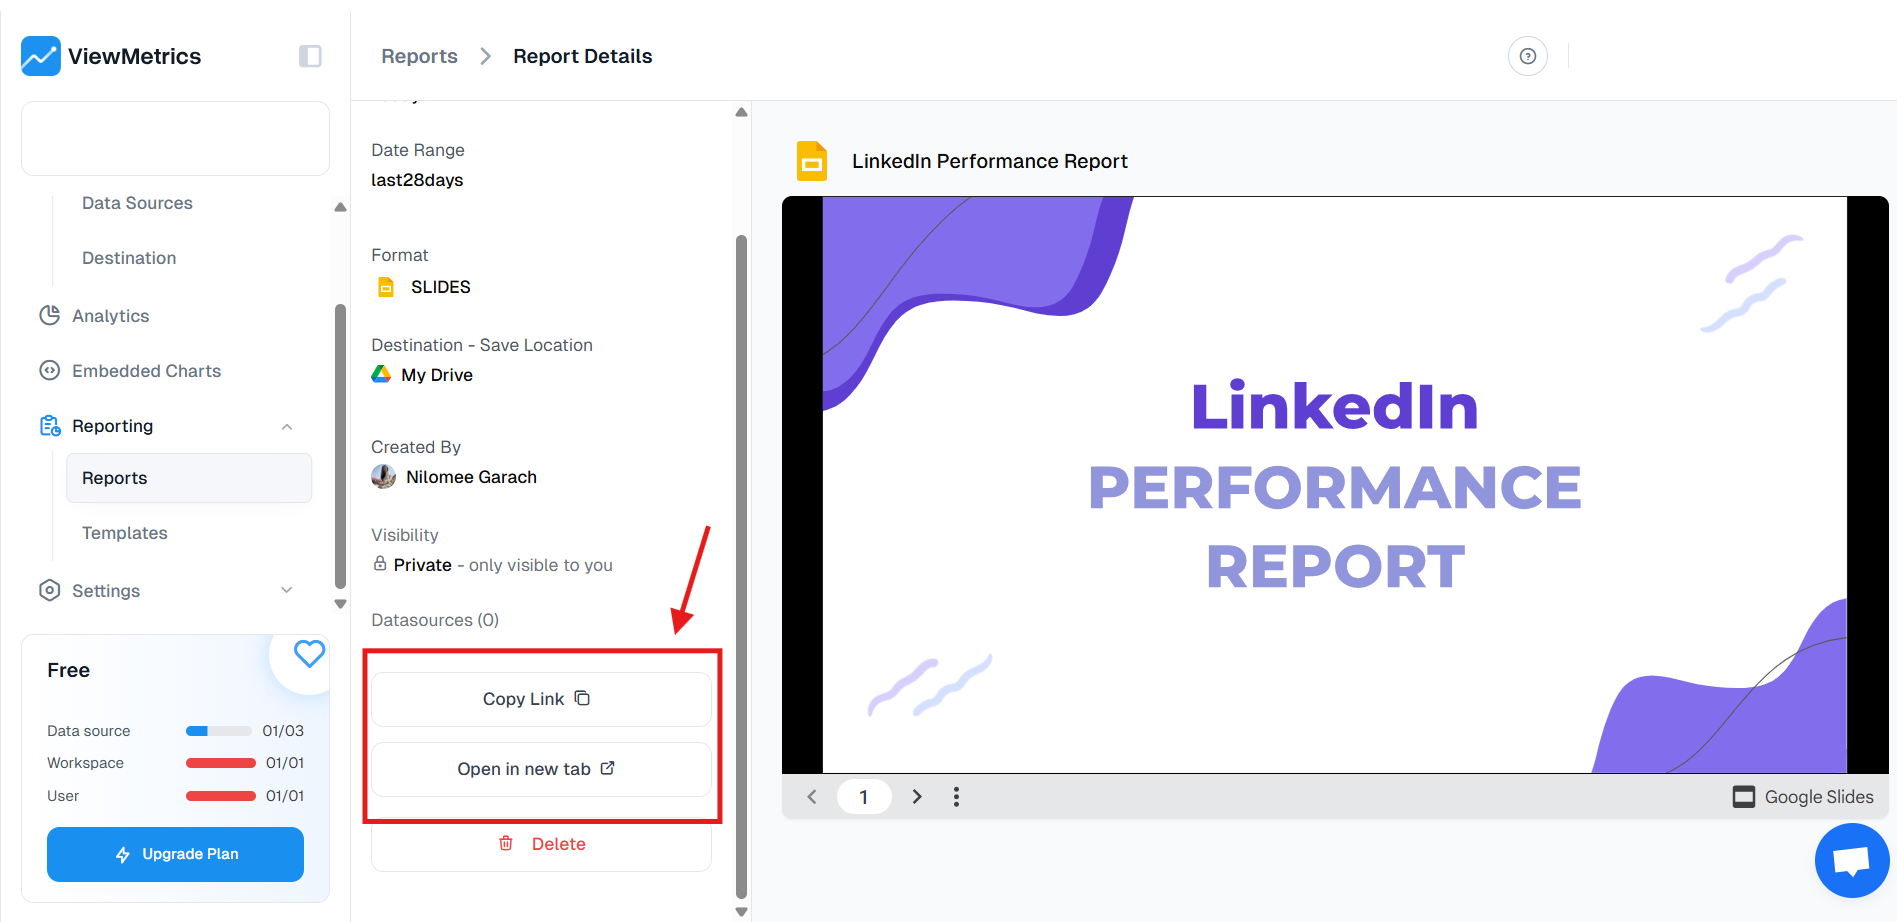
Step 7: Access and Share
Once the report is ready, you can download it, share it with your team, or keep it saved in your Google Drive for easy access later.
Want better insights into your LinkedIn marketing? Use ViewMetrics to track performance and optimize your strategy.
<VMCTA1 />
Related Article: Master LinkedIn KPIs for Maximum Engagement and Growth!
Types of Analytics Data Available on LinkedIn
LinkedIn gives you several types of analytics that help you understand how your page and content are performing. These are grouped into categories so it’s easier to look at the data and figure out what’s working and what’s not.
-
Visitor Analytics
This section shows you who’s visiting your page. You’ll get insights like their job function, industry, seniority, and where they’re located. It also tracks how many times your page is viewed and by whom.
-
Content Analytics
Also called update analytics, this tracks how your posts are doing. You’ll get data on impressions, clicks, reactions, comments, and shares. If you want to know which posts are grabbing attention and which ones are not, this is where to look.
-
Follower Analytics
Want to know more about your followers? This part of LinkedIn analytics gives you a deeper look at their job titles, industries, locations, and how your follower count is growing over time.
-
Competitor Analytics
This lets you keep an eye on your competition. You can compare your page’s performance with others in your industry by looking at things like engagement and follower growth.
-
Leads Analytics
If you use Lead Gen Forms on LinkedIn, this section helps you track the number and quality of leads collected from your page.
-
Employee Advocacy Analytics
This shows how your employees are helping to spread your content. It tracks how often they share your posts and what kind of reach that generates for your brand.
Why Export LinkedIn Analytics Data?
Exporting your LinkedIn analytics into a CSV or Excel file gives you a lot more flexibility. Here’s why it’s a good idea:
-
Understand Long-Term Performance
When you gather data over several weeks or months in one place, it becomes much easier to spot patterns. You can figure out which types of posts drive the most engagement, what topics your audience cares about, and how your content strategy is improving.
-
Improve Your Lead Generation
Exporting the data allows you to build focused lead lists. You can analyze who’s interacting with your posts and use that to improve your outreach.
-
Do Better Market Research
The exported data gives you insights into what’s happening in your industry. You can track how your competitors are doing, understand your audience better, and stay ahead of market trends.
-
Make Smarter Decisions
Instead of guessing, use real numbers to guide your content and marketing strategies. Exported analytics help you make choices that are backed by data, whether it’s planning campaigns or refining your outreach approach.
Closing Thoughts
Exporting LinkedIn analytics gives you more control over your data and helps you look at things in more depth. Whether you prefer doing it manually or using a tool like ViewMetrics, both options let you track how you’re doing and what needs to change. Try both and see what fits your workflow best.
<VMCTA2 />
Related Posts
-

Discover how data blending enhances business insights by merging data from various sources, improving decision-making,…
-

If you have a website, you need to use Google Analytics! Google Analytics can help…
-

With the help of digital analytics, businesses can better understand their product data, customer behavior,…
-

LinkedIn is not just a professional networking service, it’s also an effective platform for marketers.…
-

{ “@context”: “https://schema.org”, “@graph”: [ { “@type”: “ItemList”, “name”: “Types of Customer Data”, “itemListElement”: […