Summary of the Blog
- Analyzing Facebook ad performance is essential to ensure your ad budget is spent effectively and delivers real results.
- Utilize third-party analytics tools like ViewMetrics for simplified reporting and deeper analysis.
- Regular analysis helps optimize ad spend, refine targeting, track progress, and gather valuable insights for improving future campaigns.
Running Facebook ads is one thing; knowing if they’re working is another. Whether you’re trying to boost sales, get more leads, or grow your brand, it’s important to track how your ads are doing. Without checking the right numbers, you could end up spending money without seeing real results.
This guide will show you how to easily understand your Facebook ad performance. We’ll walk you through the key metrics, what they mean, and how to use them to make better ad decisions.
How to Analyze Facebook Ad Performance?
Analyzing Facebook ad performance is key to making sure your budget is being spent wisely. By looking at the right metrics, like reach, clicks, conversions, and return on ad spend, you can understand what’s working, what needs improvement, and how to adjust your strategy for better results. With a clear and simple approach, even small changes can lead to stronger ad performance and higher returns.
Step 1: Identify Your Audience
Before diving into numbers, it’s important to know who you’re targeting. Check the Audience Insights in your Facebook Ads Manager to understand the age, gender, location, and interests of the people engaging with your ads. This helps you confirm whether your ads are reaching the right audience or if you need to adjust your targeting.
Step 2: Set a Clear Objective
Every Facebook ad should have a clear goal, whether it’s driving traffic to your website, generating leads, increasing engagement, or boosting sales. Review your campaign objective in Ads Manager to ensure it matches what you’re trying to achieve. Analyzing Facebook ad performance without a defined objective makes it hard to tell what’s working. When your goal is clear, you can measure success more accurately and focus on the right metrics.
Step 3: Access Facebook Ads Manager
To start analyzing your ad performance on Facebook, log in to your Facebook Ads Manager. This is your main dashboard where all your ad data lives. From here, you can view campaign details, ad sets, and individual ads. You’ll also find key performance metrics like reach, impressions, clicks, and conversions. Use the filters and breakdown options to organize your data and focus on specific time periods, audiences, or placements.
Step 4: Review Key Metrics at the Campaign Level
Next, start by checking how each campaign is performing using these important Facebook KPIs:
- Click-through rate (CTR): This shows how many people clicked on your ad after seeing it. A high CTR means your ad is relevant and engaging. Learn more about what makes a good CTR.
- Conversion rate: This tells you how many people took the desired action, like signing up or making a purchase, after clicking on your ad. A strong conversion rate means your ad and landing page are working well together.
- Cost per click (CPC): This shows how much you’re paying for each click. Lower CPC often means your ad is performing well and is cost-efficient.
- Reach: This is the number of unique users who saw your ad. It helps you understand how wide your ad’s exposure is.
- Engagement rate: This includes likes, comments, shares, and any interactions. Higher engagement usually means your content resonates with your audience.
- Bounce rate: If you’re sending users to your website, this metric shows how many visitors left without taking any action. A high bounce rate may indicate your landing page needs improvement.
Step 5: Analyze Individual Ads
Once you’ve reviewed your campaign-level performance, the next step is to look closely at each individual ad. In Facebook Ads Manager, go to the “Ads” tab under your campaign to see how each creative is performing. This section shows you detailed metrics like CTR, CPC, reach, and engagement for each ad.
Check which headlines, images, or formats, like carousel or video, are driving the best results. Use the breakdown feature to analyze performance by age, gender, device, or placement. This helps you understand what’s resonating with your audience so you can pause underperforming ads and scale the ones that work.
Step 6: Utilize Facebook Pixel
Facebook Pixel is a powerful tool that helps you track what users do on your website after clicking on your ad. To use it, install the Pixel code on your website. Once it’s set up, it collects valuable data like page views, sign-ups, purchases, and other important actions.
This data helps you measure conversions more accurately and understand your audience better. With Facebook Pixel, you can also create retargeting campaigns and lookalike audiences to improve future ad performance. It’s an essential step in making sure your Facebook ads are truly working.
Step 7: Track the Number of Referrals From Social Media
Knowing how many users visit your website from Facebook ads is key to understanding their real impact. You can track these referrals using tools like Google Analytics. Simply go to the “Acquisition” section, then “Social,” and select “Facebook” to see how much traffic came from your ads.
This step helps you see if your ads are driving people to your site and how those users behave once they arrive. Are they browsing more pages, spending more time, or taking action? Tracking referrals gives you a fuller picture of your ad’s effectiveness beyond just clicks and impressions.
Step 8: Determine the Return on Investment
Understanding your return on investment (ROI) is essential to know if your Facebook ads are worth the money. To calculate ROI, compare the amount you’ve spent on ads to the revenue or leads they’ve generated.
Use this simple formula:
ROI = (Revenue from Ads – Cost of Ads) / Cost of Ads x 100
For example, if you spent $500 on ads and earned $1,500 in sales, your ROI would be 200%. This means your ads are performing well. If your ROI is low or negative, it might be time to adjust your strategy, change your creative, tweak targeting, or revisit your landing page.
Step 9: A/B Testing
A/B testing, also known as split testing, helps you figure out what works best in your Facebook ads. You run two versions of an ad, changing just one element like the headline, image, CTA, or audience, to see which one performs better. This method takes the guesswork out and gives you real data to improve future campaigns.
For example, you might test two different images or ad copies to see which one gets more clicks or conversions. Always test one variable at a time for clear results.
Learn more about – Facebook Ads A/B testing and how to do it effectively.
Step 10: Utilize Custom Reports
The Facebook ad performance report allows you to focus on the metrics that matter most to your campaign goals. Instead of viewing all default data, you can create a report that highlights key performance indicators like conversions, CTR, cost per result, or ROAS.
To build a custom report, go to the “Analyze and Report” section in Ads Manager, then click on “Ads Reporting.” From there, you can choose the metrics, date range, breakdowns (like age, gender, or device), and filters to get a clearer picture of your ad performance. These tailored insights help you make smarter decisions and refine your strategy over time.
Step 11: Review Ad Placements and Monitor Ad Frequency
Knowing where your ads appear is just as important as how they perform. In Facebook Ads Manager, you can see whether your ads are shown on Facebook, Instagram, Messenger, or the Audience Network. By reviewing placement performance, you can identify which platforms deliver the best results and adjust your strategy accordingly.
Also, keep a close eye on ad frequency, the number of times your ad is shown to the same person. If your frequency gets too high, it can lead to ad fatigue, which lowers engagement and increases cost. Aim for a balanced frequency to keep your audience interested without overexposing them.
Step 12: Use Facebook Analytics Tools
To make ad analysis easier and more organized, consider using third-party tools like ViewMetrics. It offers a Facebook ads performance report template that simplifies your reporting process. This template pulls data directly from your Facebook Ads Manager and presents it in a clean, visual format, making it easy to understand how your campaigns are performing. It saves time, helps you compare campaigns at a glance, and ensures you’re making data-driven decisions to improve future performance.
How to Analyze Facebook Ad Performance Using ViewMetrics?
Analyze Facebook ad performance in ViewMetrics by tracking key engagement, cost, and conversion data in one place to quickly see which campaigns truly drive results.
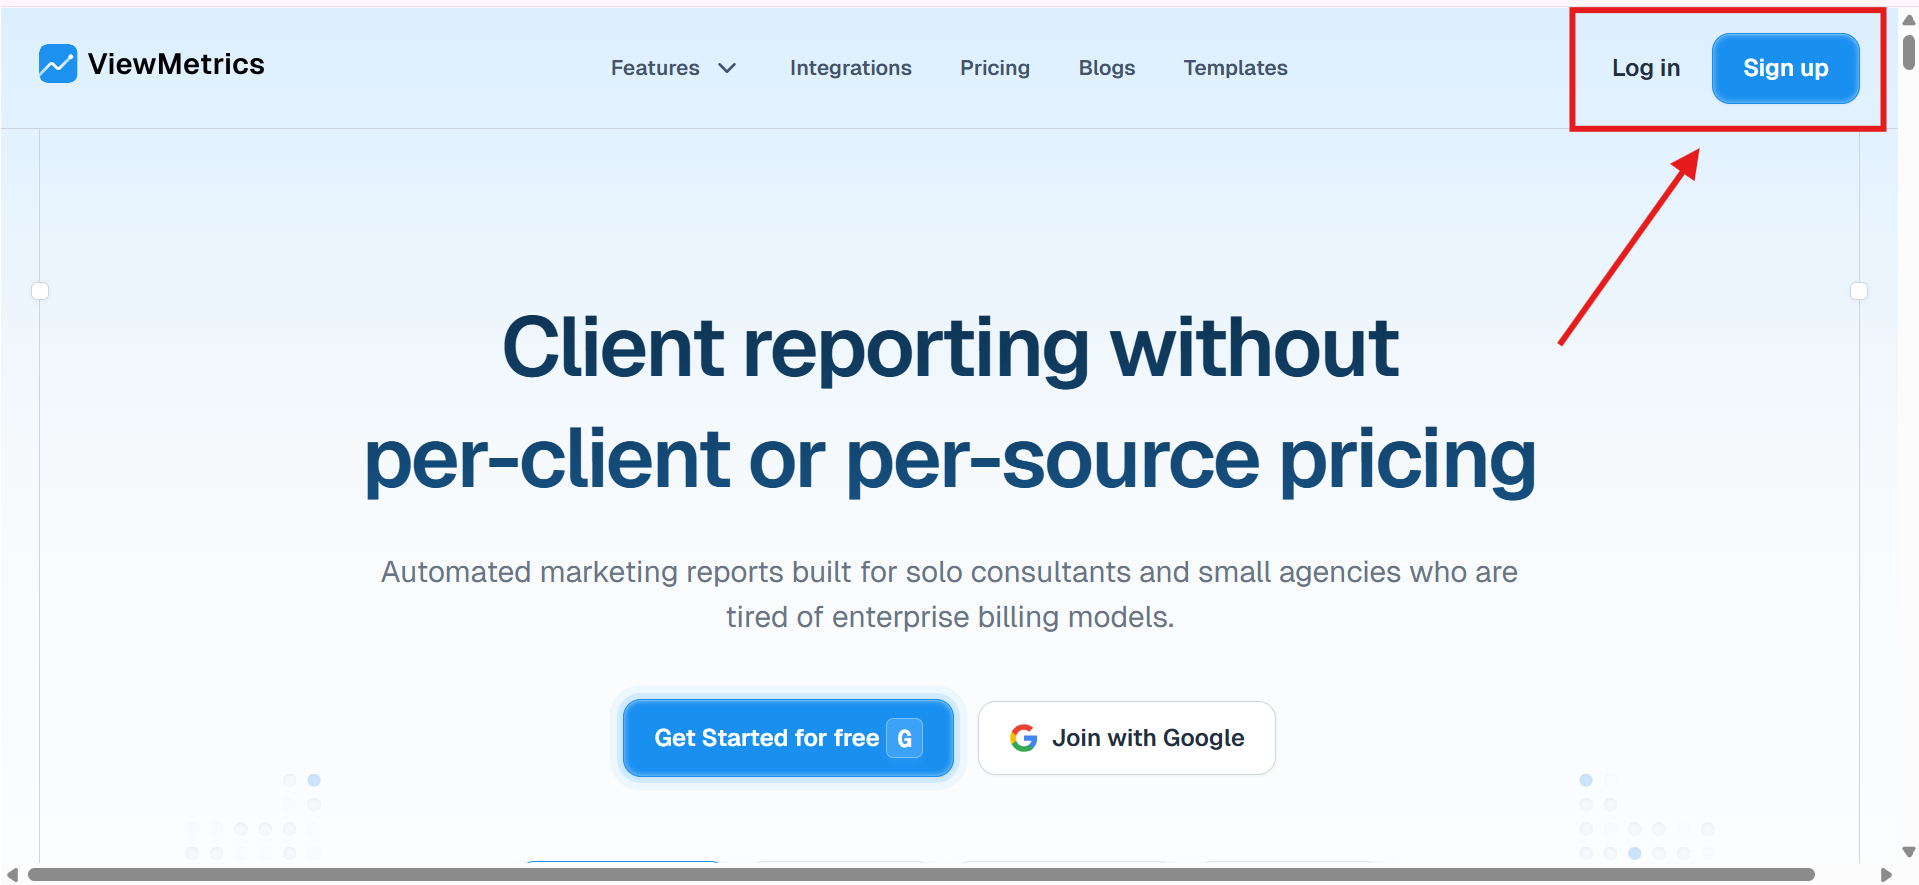
Step 1: Create or Login to ViewMetrics account
Go to ViewMetrics and sign up for an account. If you already have one, just log in.
Step 2: Connect Your Facebook Ads Account
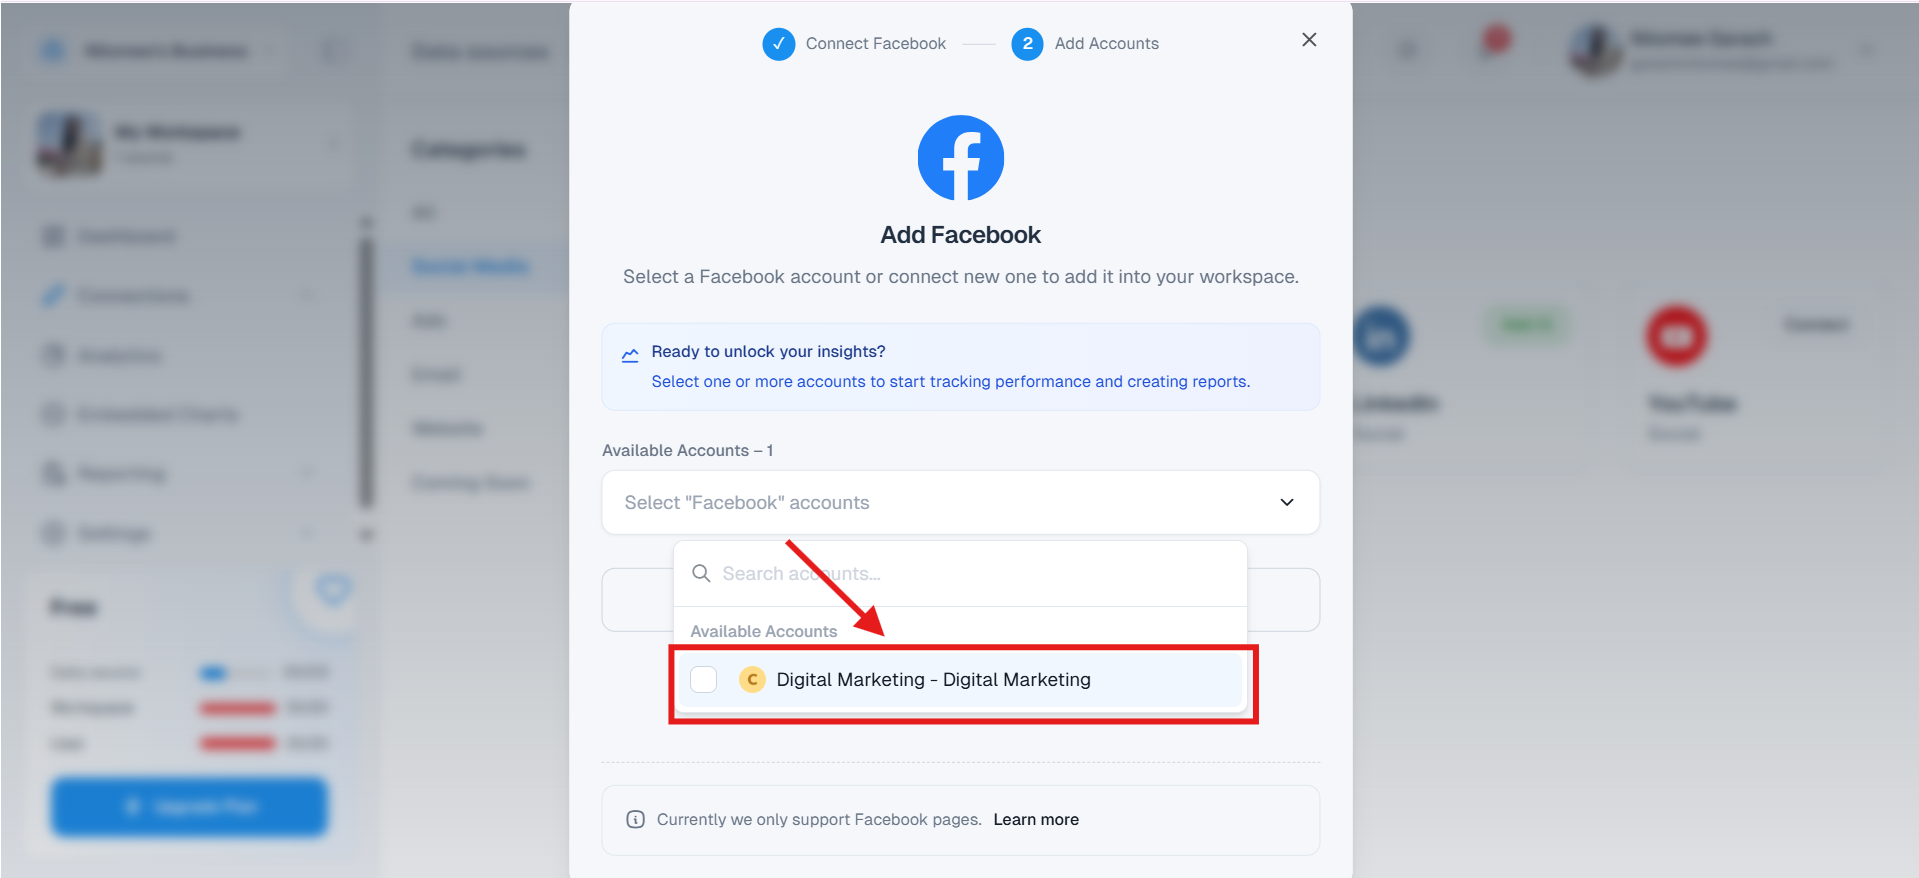
Inside the dashboard on the right side pannel, click on “Connections” dropdown and select “Data surces”. Click on Connect Data Source and choose Facebook Ads. Follow the prompts to link your Faebook Ads account securely.
Step 3: Link Your Google Drive
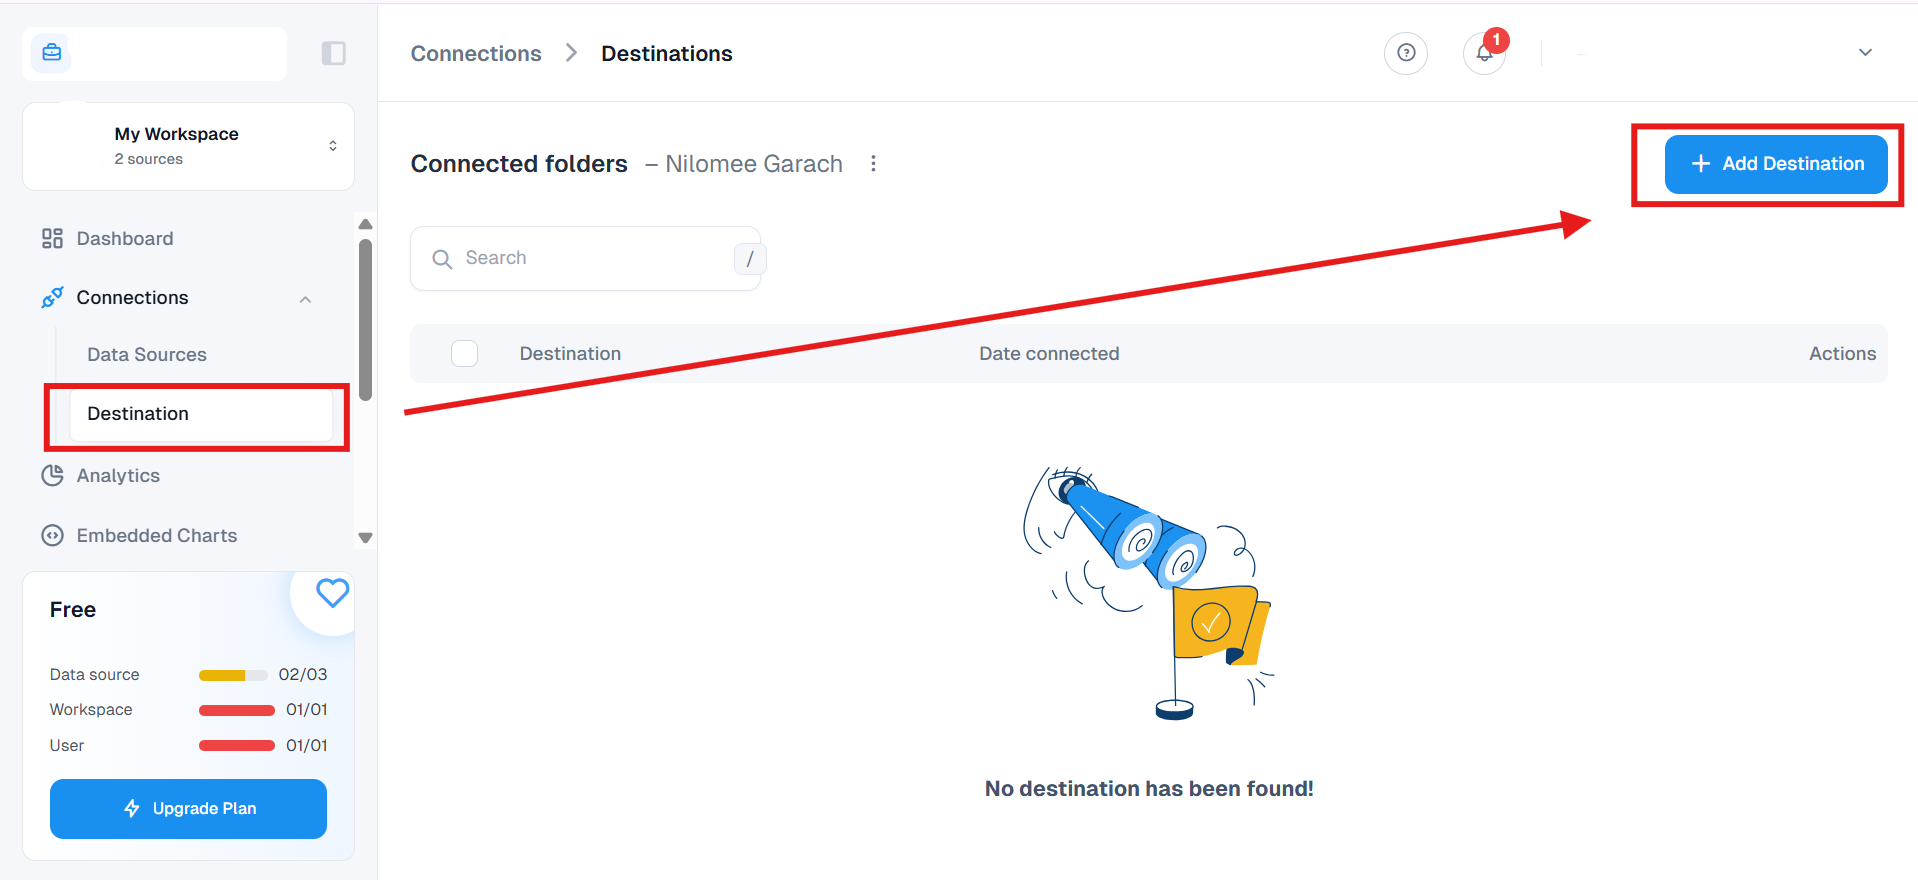
On the right side, under the “Connections” dropdown, select destination and link your Google drive account. This helps you store and access your reports directly in your Google Drive.
Step 4: Create a New Report
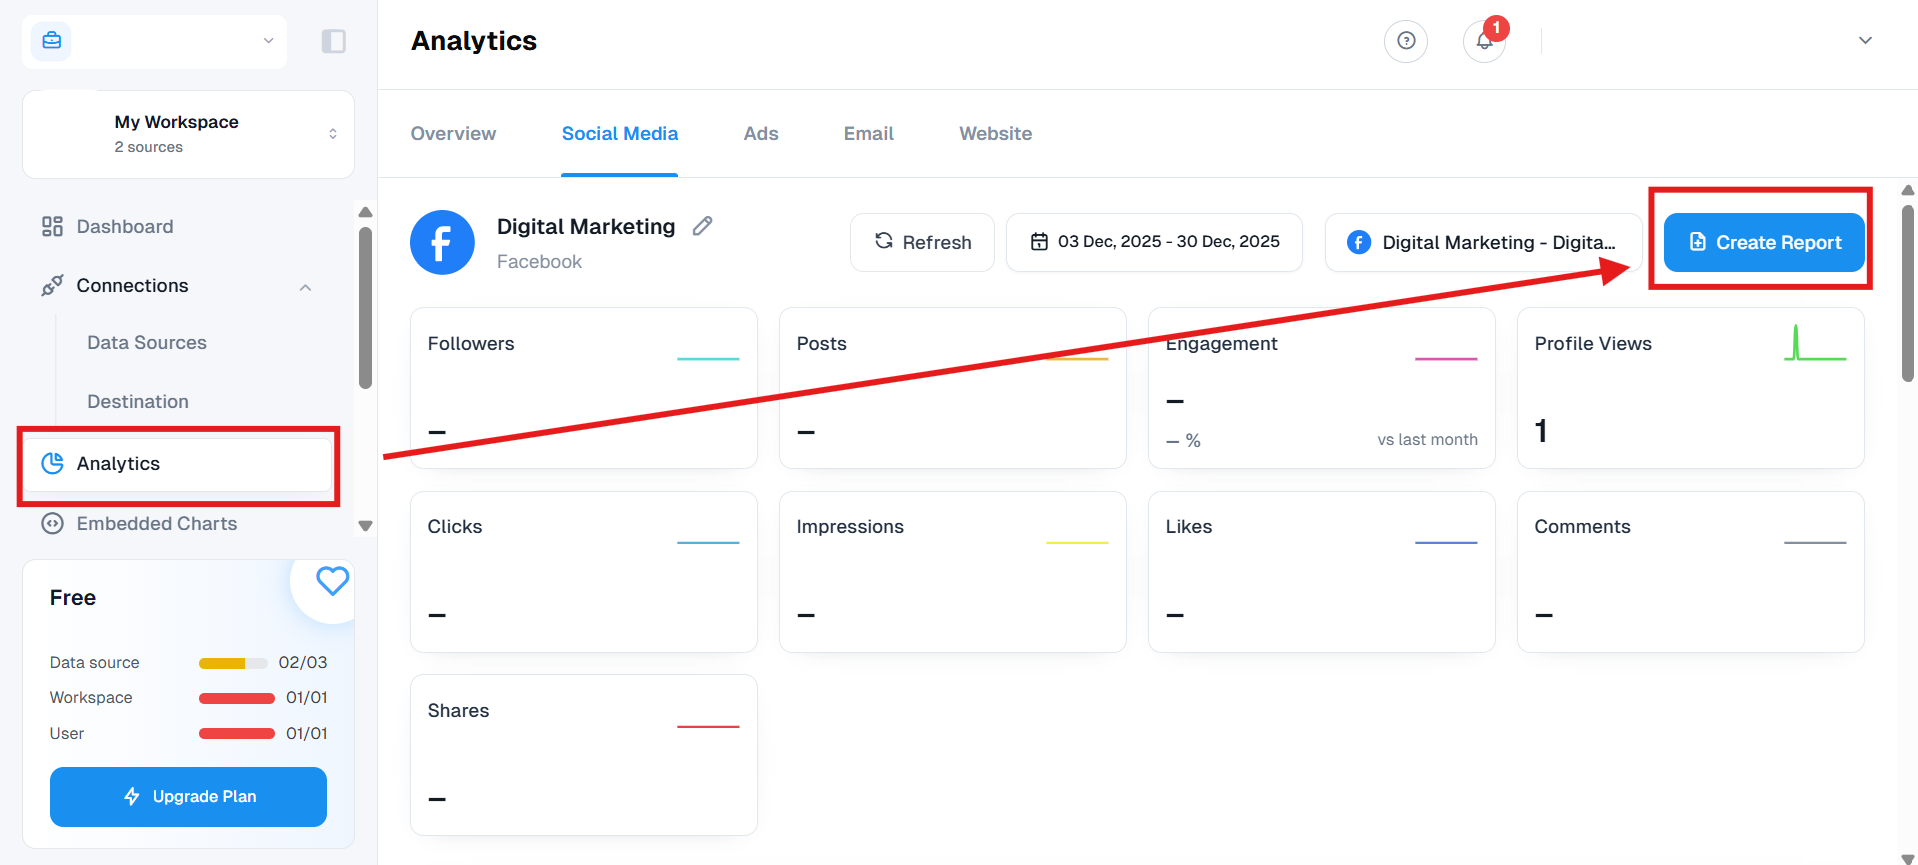
Go to the reports section and click on Create New Report. Choose the Facebook Ads Report Template from the available options.
Step 5: Choose Your Data Source and Time Range
Select your Facebook ads account from the Data source dropdown and then choose the date range for your report. This could be the last 7 days, 30 days, or a custom timeframe.
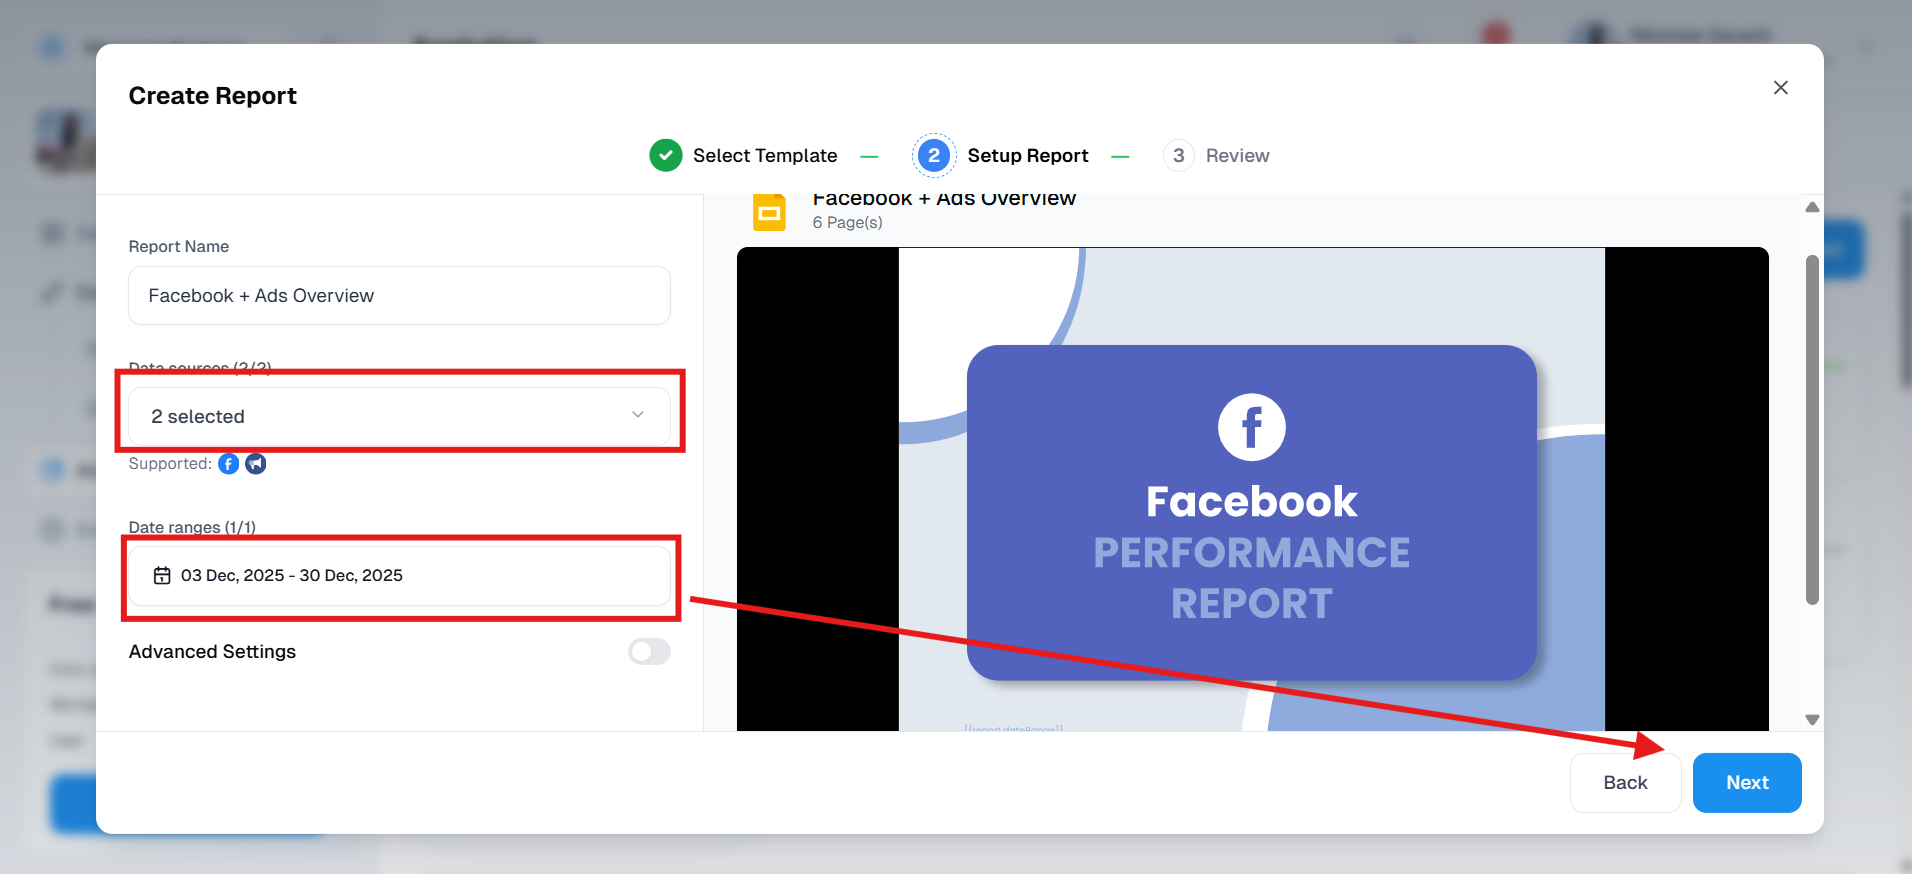
Step 6: Pick Your Report Format
Pick the format you want your report in, whether PDF, Excel, or presentation ready. Then just hit Create Report to get it.
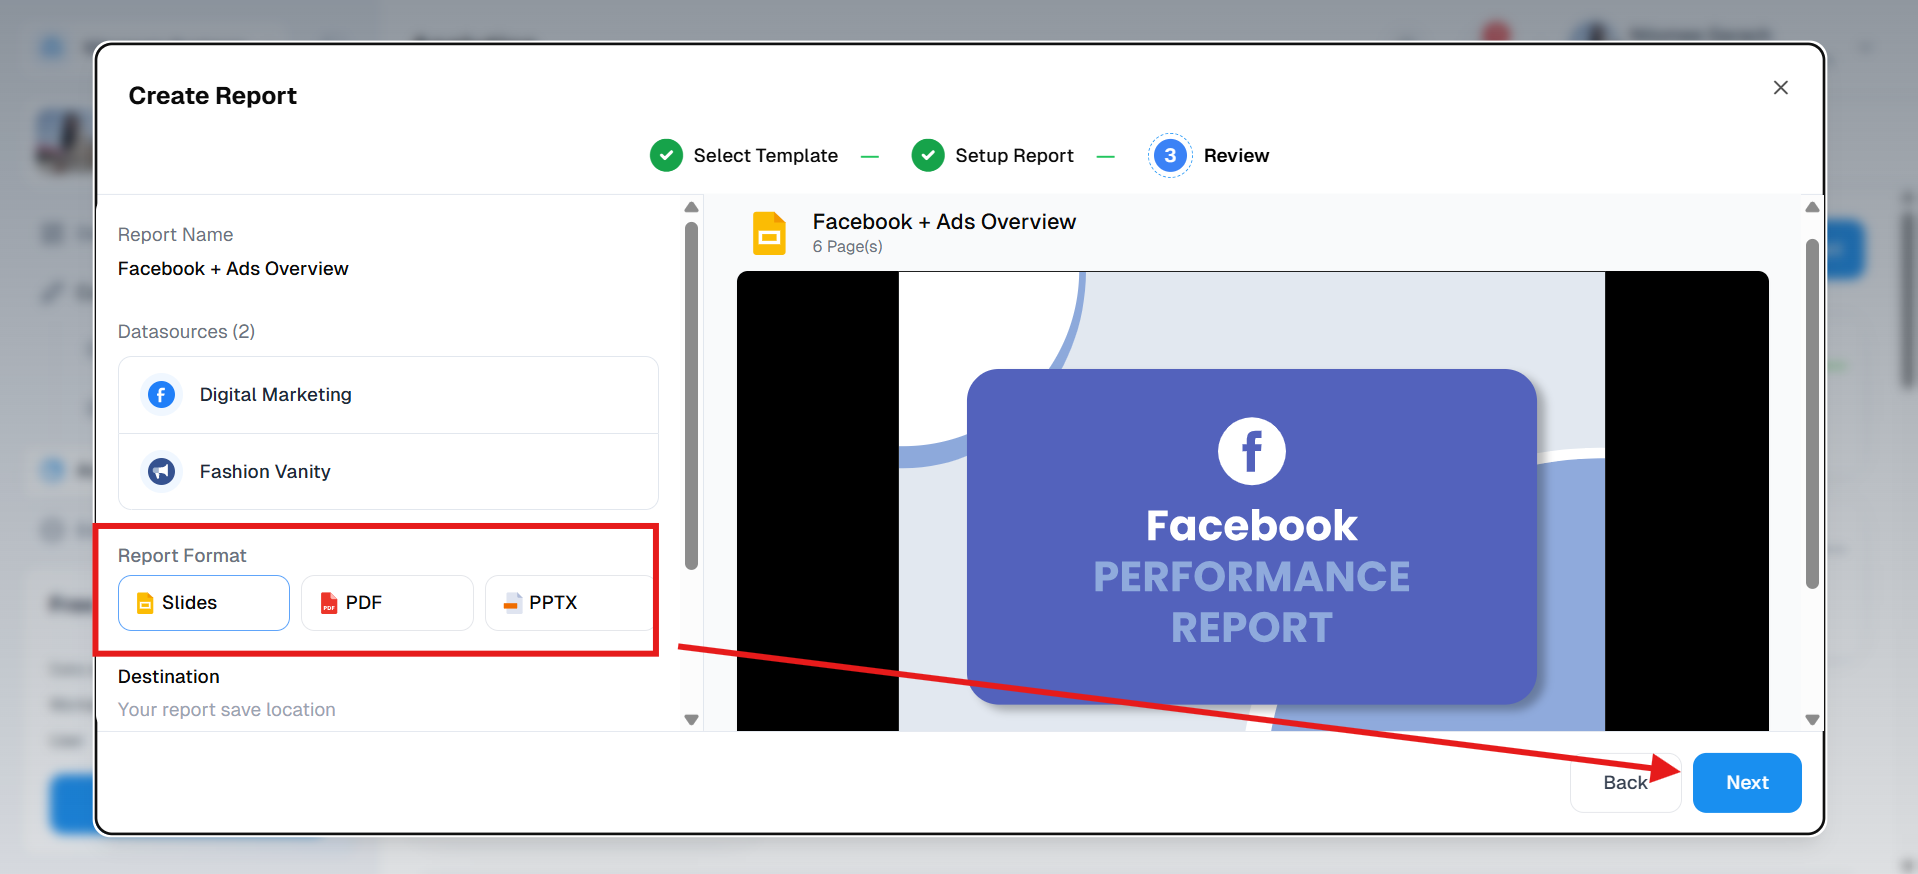
Step 7: Access and Share
Once the report is ready, you can download it, share it with your team, or save it in your Google Drive for easy access later.
Why do you need to analyze the ad performance?
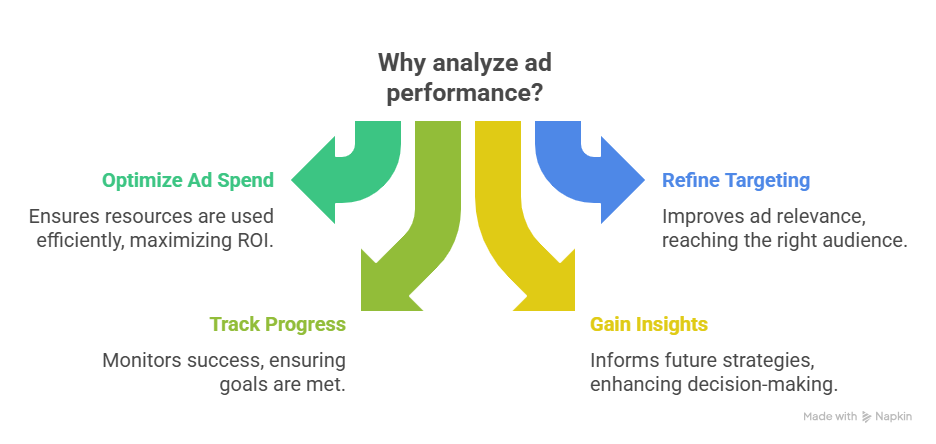
Analyzing your Facebook ad performance helps you understand what’s working and what’s not. It ensures your budget is being used effectively and guides you in making smarter decisions to improve future campaigns.
- Optimizing Ad Spend
Regular analysis helps you make sure your budget is going to the ads that perform best. This lets you cut back on what’s not working and put more money into what is. - Refine Your Targeting
By checking how different audiences respond to your ads, you can adjust your targeting. This ensures you’re reaching people who are more likely to click or convert. - Track Progress Towards Goals
Analyzing the Facebook ads performance report shows whether your ads are helping you reach specific goals, like website visits or purchases. It keeps your campaign on track. - Gaining Valuable Insights for Future Strategies
Every campaign gives you data that helps you improve the next one. These insights help shape smarter content, better targeting, and stronger overall results.
Learn the – Facebook Ads Dos and Don’ts and common mistakes to avoid when running your Facebook ad campaigns.
Analyzing your Facebook ad performance is essential for making smarter marketing decisions. By tracking the right metrics, using tools like Facebook Ads Manager and Pixel, and continually testing and optimizing, you can improve your results and maximize your ad spend. Whether you’re a beginner or scaling your campaigns, regular analysis helps you stay on track and reach your goals more effectively.
FAQs About Analyzing Facebook Ad Performance
-
How long should I run an A/B test to get useful results?
It’s best to run your A/B test for at least 3 to 7 days. This gives Facebook enough time to collect data and show you which version is working better.
-
Which metrics should I pay attention to when checking my Facebook Ads?
Keep an eye on your click-through rate (CTR), conversion rate, cost per click (CPC), reach, and engagement. These numbers help you see what’s working and what’s not.
-
What if my Facebook Ads aren’t getting any conversions?
Start by checking your audience targeting, make sure you’re reaching the right people. Then look at your ad content and landing page. If they don’t connect with users, they won’t convert. You can also tweak your budget or bidding strategy to get better results.
-
What’s a good CPM for Facebook ads?
A good CPM (cost per 1,000 views) usually falls between $5 and $15. But this can vary depending on your industry and audience.
