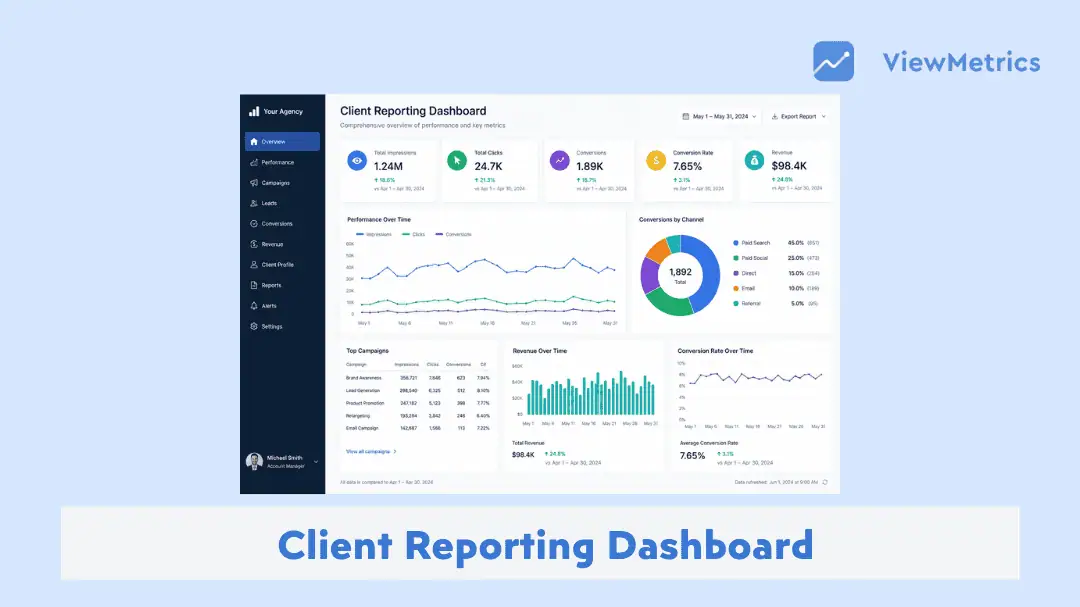
Keeping clients informed about their project’s progress is one of the most important and often most overwhelming parts of running a business. Pulling data from multiple sources, compiling reports manually, and sending updates back and forth can eat up hours of your valuable time. And even after all that effort, clients may still feel left in the dark about how their investments are actually performing.
That’s where a client reporting dashboard changes everything. Instead of juggling spreadsheets and scattered data, a dashboard brings all your key metrics into one clear, visual, and easy-to-share space. It saves you time, builds client trust, and keeps everyone on the same page without the back-and-forth. In this guide, we’ll break down exactly what a client reporting dashboard is and walk you through how to build one from scratch.
What Is a Client Reporting Dashboard?
A client reporting dashboard is a centralized platform that collects and displays performance data from multiple sources in a visual format.
It is used by teams to track KPIs, monitor campaigns, and share insights with clients in real time.
Unlike static reports, dashboards update automatically and provide interactive views of data. This makes it easier to understand performance, identify trends, and take action quickly.
What Are the Benefits of a Client Reporting Dashboard?
1. Real-Time Data Access
A dashboard provides live data updates, allowing teams and clients to monitor performance instantly and identify issues early without waiting for scheduled weekly/monthly reports.
2. Enhanced Communication
With dashboards, you can share performance insights visually, which improves clarity between teams and clients.
So, instead of reading long reports, clients can quickly understand performance at a glance.
3. Increased Accountability
Dashboards allow everyone to see progress and understand what is working and what needs improvement. It provides clear KPIs and performance tracking, which increases accountability for both your team and clients.
4. Customization & Flexibility
A dashboard can be customized based on client goals and industry needs. This ensures that each client sees insights and metrics that are relevant to their specific needs.
5. Improved Decision-Making
Another benefit of a client reporting dashboard is that you can effortlessly combine data from multiple sources. With this, you get a complete view of performance. This helps teams make data-driven decisions and optimize strategies effectively.
8 Essential Features of a High-Performing Client Dashboard
A high-performing dashboard has all the right features to improve usability and insights. Below are the 8 most essential features to have in a client reporting dashboard to make it more impactful:
1. Clear Data Visualization
Adding visual elements like graphs or charts to the dashboard helps in simplifying complex data. This makes it easier for clients to understand performance quickly.
2. Deeper Data Exploration
What makes a dashboard more useful and effective is the way a user can interact with the data. They should be able to explore data in detail by clicking into specific metrics.
Adding drill-down capabilities allows users to dig deeper into specific campaigns, channels, or time periods.
3. Goal & Benchmark Tracking
Dashboards should track KPIs against predefined goals and benchmarks to measure success accurately.
4. White-Label & Branding Options
Custom branding ensures that reports and dashboards align with your agency’s identity. This creates a more professional experience for clients.
5. Centralized Data Integration
A good dashboard pulls data from multiple platforms into one place, eliminating the need to switch between tools.
6. Secure Access & Permissions
Dashboards should include role-based access so that clients only see relevant data, ensuring better privacy and control.
7. Actionable Insights & Context
A dashboard should not just display numbers but also provide context. This helps clients understand what actions to take next.
8. Automated Data Updates
Manual updates can lead to delays and errors in reporting. Automating your dashboard ensures that data stays accurate and up to date at all times. This not only saves time but also builds trust by providing reliable insights.
How to Create a Client Reporting Dashboard: Step-by-Step Process
Step 1: Set Clear Goals & Reporting Objectives
- Start by defining what success looks like for your client.
- Identify the outcomes they care about, such as leads, revenue, or engagement.
- Clear objectives help you decide what data to include and ensure the dashboard stays focused on meaningful insights rather than unnecessary metrics.
Step 2: Identify the Right KPIs to Track
- Choose KPIs that directly reflect performance and business impact.
- The right metrics help your client make better decisions that align with their goals, rather than just tracking everything available.
- For example, instead of only tracking impressions, include conversion rates and cost per acquisition to show actual results.
Step 3: Connect & Consolidate Data Sources
- Bring data from all relevant platforms into one place. This may include tools like Google Analytics, ad platforms, CRM systems, or social media channels.
- Centralizing your data ensures accuracy, reduces manual work, and gives you a complete view of performance across channels.
Step 4: Choose the Right Dashboard Tool
- Using the right tool is essential to avoid manual reporting and ensure scalability.
- A good tool should support integrations, automation, and customizable dashboards.
- Tools likeViewMetrics allow you to connect multiple data sources, create visual dashboards, and automate reporting workflows to help you build a scalable client reporting dashboard without relying on manual updates.
Step 5: Design a Clear & Structured Layout
- It’s important to organize your dashboard for easy navigation and readability.
- Place high-level KPIs at the top, followed by detailed metrics and breakdowns.
- Use clean visuals like charts and graphs to make it easier for clients to understand performance.
Step 6: Automate Updates & Reporting
- Automation ensures your dashboard stays up to date without manual effort.
- Set up automatic data refresh and scheduled reporting where needed.
- This improves efficiency and ensures your clients always have access to the latest performance data.
Step 7: Review, Optimize, & Improve
- A dashboard should evolve over time based on client feedback and changing goals.
- Regularly review its performance and refine the layout, metrics, or insights. This ensures your client reporting dashboard remains relevant, useful, and aligned with business objectives.
<VMCTA1 />
Examples of Client Reporting Dashboards: Use Cases for Marketers
Different businesses require different types of dashboards depending on their goals, data sources, and decision-making needs. A well-designed client reporting dashboard should align with the specific use case and highlight the most relevant KPIs.
1. Marketing Client Reporting Dashboard
This dashboard can be used by marketing teams and agencies to track campaign performance across multiple channels. It helps clients understand how their marketing efforts are contributing to conversions, revenue, and overall growth.
Key Marketing Metrics:
- Daily purchases
- Cost per purchase
- Impressions by channel
- CPM (cost per thousand impressions)
- Conversion rate by channel
- Purchases by channel
- Revenue by channel
- Cost per purchase by channel
- Return on ad spend (ROAS) by channel
- Campaign-level revenue and ROAS
2. SEO Reporting Dashboard
An SEO reporting dashboard focuses on organic performance and website engagement. It helps businesses track how their SEO strategies impact traffic, user behavior, and content performance over time.
This dashboard is especially useful for identifying trends, measuring growth, and optimizing content strategy.
Key SEO Metrics:
- Organic sessions
- Page views
- Bounce rate
- Pages per session
- Average session duration
- Monthly organic traffic comparison
- Organic sessions trend
- Page views trend
- Landing page performance
3. PPC Client Reporting Dashboard
A PPC reporting dashboard is designed to track paid advertising performance across platforms like Google Ads and social media. It helps marketers evaluate campaign efficiency, optimize ad spend, and improve conversions.
This dashboard is essential for understanding the cost-effectiveness of a campaign and its return on investment.
Key PPC Metrics:
- Ad spend
- Cost per click (CPC)
- Cost per purchase
- Number of clicks
- Number of conversions
- Conversion rate
- Return on ad spend (ROAS)
- Campaign performance by platform
4. eCommerce Sales Client Reporting Dashboard
This sales dashboard can be used by eCommerce businesses to monitor sales performance and customer behavior. It provides insights into revenue, order trends, and product performance, helping teams optimize pricing, inventory, and promotions.
Key eCommerce Metrics:
- Total sales
- Discounts applied
- Shipping revenue
- Sales taxes
- Average order value
- Total items sold
- Customer count
- Order volume
- Gross margin
- Cost of goods sold
- Revenue by product
- Revenue by region
- Orders by discount code
5. Financial Client Reporting Dashboard
Finance teams, consultants, and business advisors use this dashboard to evaluate a company’s financial health. It helps stakeholders understand how cash flows through the business and whether operations are sustainable, supporting better financial planning and forecasting.
Key Finance Metrics:
- Cash balance
- Cash flow change
- Operating cash flow
- Investing cash flow
- Financing cash flow
- Cash flow by account
- Monthly cash flow trends
6. Executive Client Reporting Dashboard
An executive dashboard provides a high-level overview of business performance for leadership teams. It focuses on key business outcomes rather than detailed metrics, helping decision-makers quickly assess growth, profitability, and operational efficiency.
Key Metrics:
- Revenue and profit
- Number of leads
- Customer lifetime value
- Monthly recurring revenue (MRR)
- One-time revenue (OTR)
- Client retention rate
- Client churn rate
- Average client retention term
- Employee utilization
- Employee retention rate
5 Common Mistakes to Avoid When Creating Client Reporting Dashboards
Even a well-built client reporting dashboard can fail if certain mistakes are not addressed. Avoiding these issues ensures your dashboard remains clear, actionable, and useful for clients.
- Adding Too Much Data: Having too many metrics in your dashboard can make the dashboard difficult to understand. Instead of trying to show everything, focus only on KPIs that matter to business goals.
- Tracking Activity Instead of Business Impact: Many dashboards focus on vanity metrics without connecting them to outcomes. Your dashboard should always link performance metrics to actual business impact.
- Using a One-Size-Fits-All Dashboard for Every Client: Every client has different goals, industries, and expectations. Using the same dashboard for all clients reduces its relevance and effectiveness.
- Manually Adding Data: Manual data entry can increase the risk of errors. Automating your dashboard ensures accuracy, efficiency, and real-time insights.
- Choosing Incorrect or Misleading Visualizations: Using the wrong chart types can make data harder to interpret and even lead to incorrect conclusions. Selecting simple and appropriate visuals improves clarity and usability.
Why Use ViewMetrics to Create a Client Reporting Dashboard?
Building a client reporting dashboard manually can be time-consuming and inconsistent. ViewMetrics simplifies the entire process by helping you automate, visualize, and manage reporting in one place.
- Automated data collection: Connect multiple platforms and pull data automatically, so you do not have to rely on manual updates or spreadsheets.
- Real-time dashboards:Create live dashboards that update instantly, allowing clients to track performance without waiting for reports.
- Customizable templates: Use ready-made templates or design your own dashboards based on client goals and reporting needs.
- Multi-source data integration: Combine data from ads, analytics, CRM, and other tools into one unified dashboard for a complete performance view.
<VMCTA2 />
Frequesntly Asked Questions
-
Who needs a client reporting dashboard?
Any business that manages client performance data, such as agencies, consultants, and SaaS teams, can benefit from using dashboards to improve reporting and communication.
-
How do you choose the right KPIs for a client dashboard?
Focus on metrics that directly impact business goals and help clients make decisions. Avoid including unnecessary or vanity metrics.
-
What data sources can be connected to a client dashboard?
Most dashboard tools connect with all the necessary data sources like analytics tools, CRM systems, ad platforms, and databases to provide a unified view of performance.
-
How often should dashboards be updated?
Dashboards should update based on the use case, such as real-time for marketing and weekly or monthly for financial data.
-
Should you build a custom dashboard or use a tool?
Using an existing tool is faster and easier to manage, while custom dashboards are useful if you have highly specific needs, need deep integration with proprietary systems, or have a dedicated development team.
Related Posts
-

What Is Client Reporting? Client reporting is the structured process of sharing, analyzing, and presenting…
-

Data is everywhere. You open five tools, ten tabs, and still struggle to see what…
-

{ “@context”: “https://schema.org”, “@type”: “Article”, “headline”: “Automated Reporting vs Manual Reporting”, “description”: “A complete…
-

{ “@context”: “https://schema.org/”, “@type”: “BreadcrumbList”, “itemListElement”: [{ “@type”: “ListItem”, “position”: 1, “name”: “Home”, “item”: “https://www.viewmetrics.com”…
-
Learn what a tactical dashboard is. Discover the benefits, types, key features, and how to…