If you work with data daily, you already know how messy things can get. Reports everywhere, numbers that don’t match, and too many tabs open at once. This is where a tactical dashboard starts to make sense.
In this blog, we will break down what a tactical dashboard is, how it helps in day-to-day work, what features actually matter, and how you can create one without overcomplicating things.
What Is a Tactical Dashboard?
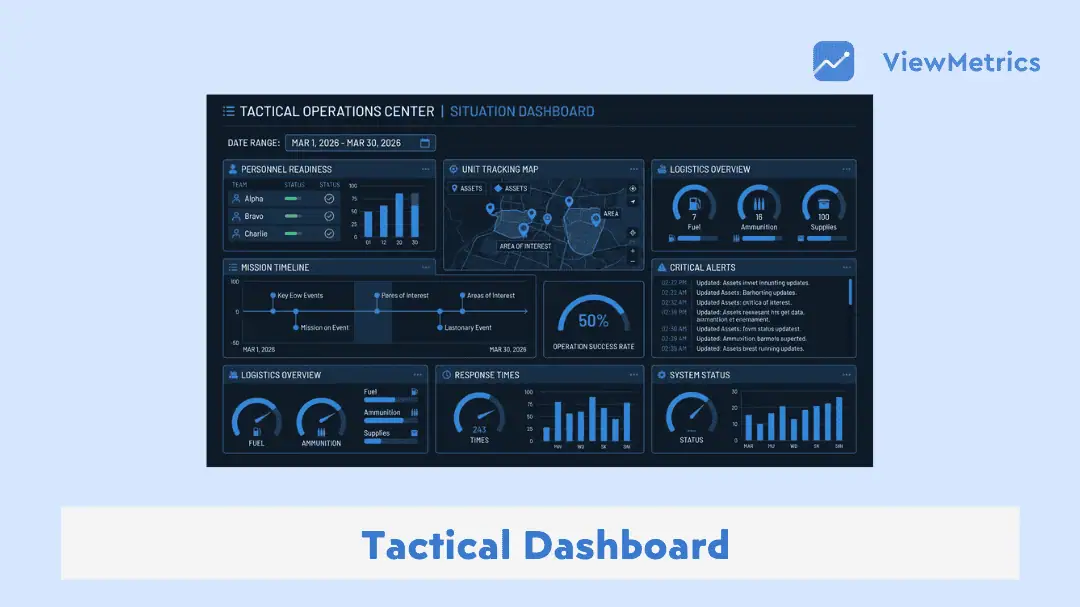
A tactical dashboard is a data tool designed to help teams track short-term performance and take quick action. It focuses on day-to-day or weekly metrics like sales numbers, campaign performance, or operational delays. Unlike long-term reports, this dashboard is built for people who need to make decisions regularly, not just review progress occasionally.
Read our complete guide: 4 Types of Dashboards Every Business Needs
Benefits of Tactical Dashboards
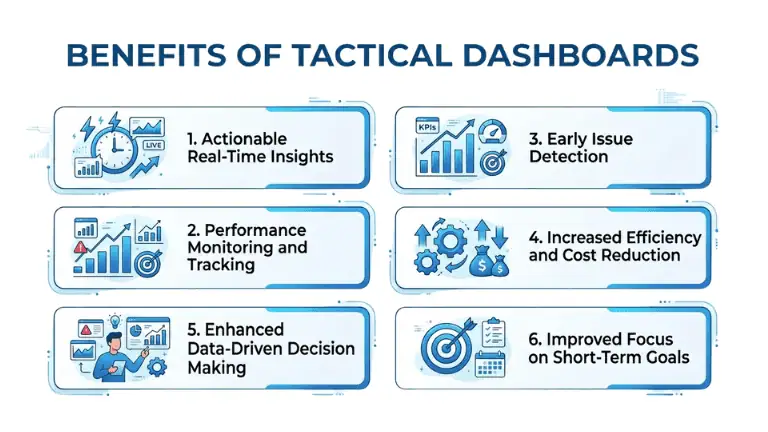
Here’s an in-depth look at how tactical dashboards help in real working environments:
-
Actionable Real-Time Insights
Most teams struggle with delayed information. By the time you see a report, the situation has already changed.
A tactical dashboard removes that gap. You can see updates as they happen or close to it. If a campaign suddenly drops or sales slow down, you notice it early. That gives you a chance to react instead of playing catch-up later.
-
Performance Monitoring and Tracking
Instead of checking multiple tools, everything is visible in one place. You can track how your team is performing against targets and quickly see if something is off track.
-
Early Issue Detection
Small issues often turn into bigger problems when ignored. A tactical dashboard helps you spot dips, delays, or unusual patterns early, so you can fix them before they escalate.
-
Increased Efficiency and Cost Reduction
When you have clear visibility, you spend less time searching for data and more time acting on it. This saves effort and also reduces unnecessary spending caused by delays or poor decisions.
-
Enhanced Data-Driven Decision Making
Decisions become less about assumptions and more about actual numbers. When data is right in front of you, it is easier to justify actions and stay aligned with business goals.
-
Improved Focus on Short-Term Goals
Tactical dashboards keep everyone focused on what needs attention right now. Instead of getting lost in long-term plans, teams can concentrate on immediate outcomes and daily priorities.
Types of Tactical Dashboards
Different teams use tactical dashboards in different ways. Here are some common types you will come across:
-
Sales Tactical Dashboard
Used by sales teams to track daily revenue, pipeline movement, conversions, and deal closures. It helps sales managers quickly understand where targets are being met and where support is needed.
-
Marketing Tactical Dashboard
Focuses on campaign performance, leads, click-through rates, and cost per acquisition. This helps marketers adjust campaigns in real time instead of waiting for campaign reports.
Read our complete guide: What Is a Marketing Dashboard and How to Create One?
-
Customer Retention Dashboard
Tracks churn rate, repeat customers, inactive users, and engagement levels. It helps teams understand whether customers are staying or dropping off.
-
Operations Tactical Dashboard
Used to monitor processes like delivery timelines, production output, or service efficiency. It is commonly used in logistics, manufacturing, and service-based businesses.
Key Features of an Effective Tactical Dashboard
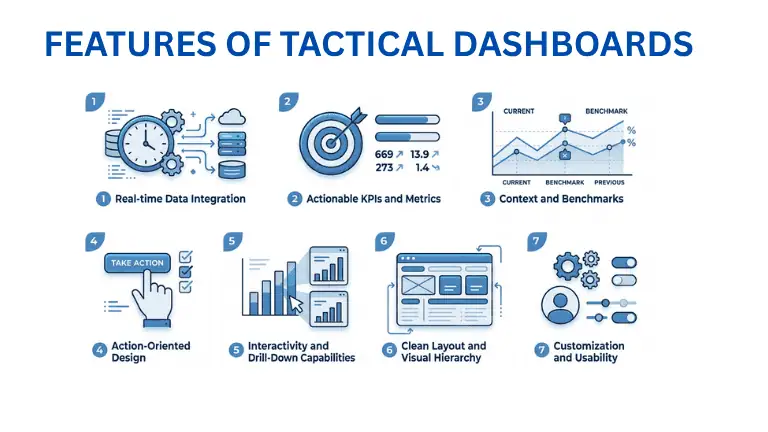
Not all dashboards are useful. Some look good but don’t actually help in decision-making. Here’s what makes a tactical dashboard practical:
-
Real-time Data Integration
The dashboard should pull data automatically from your systems. Manual updates slow things down and increase the chances of errors.
-
Actionable KPIs and Metrics
Every metric shown should lead to a decision. If a number does not help you act, it probably does not belong on the dashboard.
Read our complete guide: What Is KPI? Types, Examples & How to Track KPIs Effectively
-
Context and Benchmarks
Numbers alone are not enough. You need context. Whether it is a target, previous performance, or industry benchmark, comparison helps you understand what the data actually means.
-
Action-Oriented Design
The layout should guide your attention. Important metrics should be easy to find, and problem areas should stand out without needing too much effort.
-
Interactivity and Drill-Down Capabilities
A good dashboard allows you to click and explore deeper. If you notice a drop in performance, you should be able to investigate the reason directly within the dashboard.
-
Clean Layout and Visual Hierarchy
Too much clutter makes dashboards confusing. A clean layout with proper spacing and simple visuals helps you read information quickly.
-
Customization and Usability
Different teams need different views. A useful dashboard allows customization so that each user can focus on what matters to them.
How to Create a Tactical Dashboard?
Here’s a simple way to approach building your own dashboard without overcomplicating the process:
-
Define Your Goal and Audience
Start with clarity. Who is going to use this dashboard? A sales manager, a marketing team, or someone in operations?
Each group looks for different answers. A sales team may care about conversions and deal stages. A marketing team may care about campaign performance.
Once you know who the dashboard is for, it becomes easier to decide what should go into it.
-
Identify Actionable Metrics
This is where most dashboards go wrong. They try to show everything.
Instead, focus only on numbers that lead to action. For example, conversion rate tells you if your funnel is working. Customer drop-off tells you something needs fixing.
Avoid adding numbers just because they look important. If it does not help you decide something, leave it out.
-
Select Data Sources and Prepare Data
Now figure out where your data is coming from. This could be your CRM, analytics tools, spreadsheets, or internal systems.
Before you connect everything, clean your data. Remove duplicates. Fix formatting issues. Make sure the numbers are consistent.
If the data is messy, the dashboard will be misleading.
-
Design the Layout
Before building, sketch a simple structure. Place the most important metrics where they are easy to see. Group related data together so it feels organised.
-
Choose the Right Visuals
Not every chart works for every type of data.
Use line charts for trends over time. Use bar charts for comparisons. Use simple indicators for progress tracking.
Avoid overcomplicating visuals. If it takes effort to understand a chart, it is probably not the right one.
-
Build and Refine
Use a dashboard tool to bring everything together. Add filters, dropdowns, or drill-down options so users can explore deeper when needed.
-
Test and Improve
Share the dashboard with your team. Ask if anything feels confusing or slow. Make changes based on feedback. A dashboard is never truly finished; it improves over time.
Use Cases of Tactical Dashboards
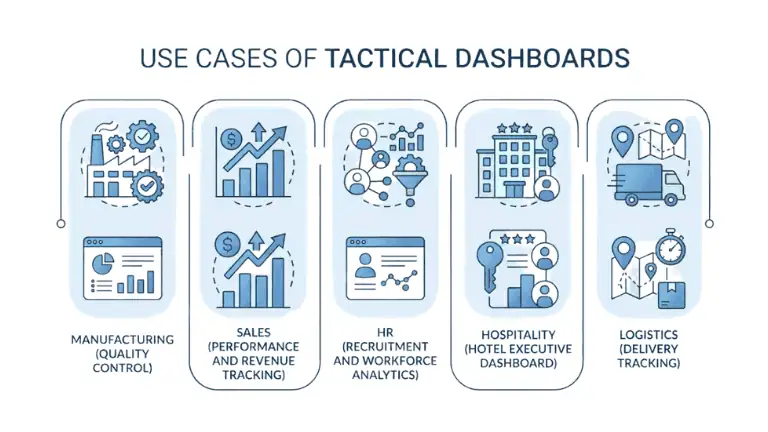
Tactical dashboards are used across different industries. Here are a few practical examples:
-
Manufacturing (Quality Control)
Track defect rates, production output, and machine performance. This helps teams maintain quality and avoid delays.
-
Sales (Performance and Revenue Tracking)
Monitor daily sales numbers, deal progress, and team performance to ensure targets are being met.
-
HR (Recruitment and Workforce Analytics)
Track hiring pipelines, time to hire, and employee performance metrics. This helps HR teams stay organised and efficient.
-
Hospitality (Hotel Executive Dashboard)
Monitor occupancy rates, bookings, cancellations, and revenue to make quick operational decisions.
-
Logistics Operations (Delivery Tracking)
Track shipment status, delays, and delivery timelines. This helps improve customer satisfaction and operational efficiency.
Tools to Create a Tactical Dashboard
There are many tools available, but the right one depends on how simple or advanced you want your setup to be.
-
ViewMetrics
If you want a straightforward solution, ViewMetrics is built for exactly this purpose. You can upload your data, choose a format, and generate dashboards without needing technical knowledge. It is designed for teams that want quick insights without spending time on setup.
<VMCTA2 />
-
Tableau
Tableau is more advanced and gives you deeper control over how your dashboard looks and behaves. It is widely used by analysts and larger teams.
-
Excelmatic
For those who prefer working with spreadsheets, Excelmatic offers a simpler way to turn data into dashboards without moving too far from a familiar setup.
-
Looker Studio
A free tool that connects well with Google products. Useful for creating basic dashboards quickly.
Closing Thoughts
A tactical dashboard is not about making things look fancy. It is about making your day-to-day work clearer.
When you can see what is happening without digging through reports, decisions become faster. Problems become easier to catch. Teams stay aligned without constant follow-ups.
If your current setup feels scattered or slow, moving to a tactical dashboard can simplify things more than you expect.
Frequently Asked Questions (FAQs)
-
How is a tactical dashboard different from a strategic dashboard?
Strategic dashboards focus on long-term goals and high-level metrics. Tactical dashboards focus on short-term performance and daily actions that teams need to take.
-
What metrics should a tactical dashboard include?
Metrics like conversion rates, pipeline movement, backlog size, churn rate, and service delays are commonly used. The focus should always be on actionable data.
-
Who should use a tactical dashboard?
Managers, team leads, and operations teams who handle day-to-day execution benefit the most from tactical dashboards.
-
Can I create my own tactical dashboard without technical skills?
Yes. Tools like ViewMetrics allow you to create dashboards without coding. You can upload your data and build dashboards using simple interfaces.
-
How often should a tactical dashboard be updated?
Most tactical dashboards are updated daily or in real time, depending on how fast your business moves.
-
What makes a good tactical dashboard?
It should be clear, easy to read, focused on actionable metrics, and simple enough to use without training.
Related Posts
-
A strategic dashboard is a tool that gives you a clear, high-level view of how…
-
An operational dashboard is a tool that shows live or near-real-time data related to daily…
-

Understand what marketing dashboards are, how they work, and why they are valuable for driving…
-

Learn about the importance of KPI dashboards, their benefits, and best practices for creating and…
-
A dashboard is a visual aid that presents the most crucial facts and KPIs for…