Data is not the problem anymore. Most businesses already have more data than they know what to do with. The real issue is understanding it without getting overwhelmed.
That is where analytical dashboards start to matter. Instead of jumping between tools, reports, and spreadsheets, everything comes into one place.
In this blog, we will take a look at what analytical dashboards are, why people rely on them, how you can build one, and where they actually fit into day-to-day work.
What is an Analytical Dashboard?
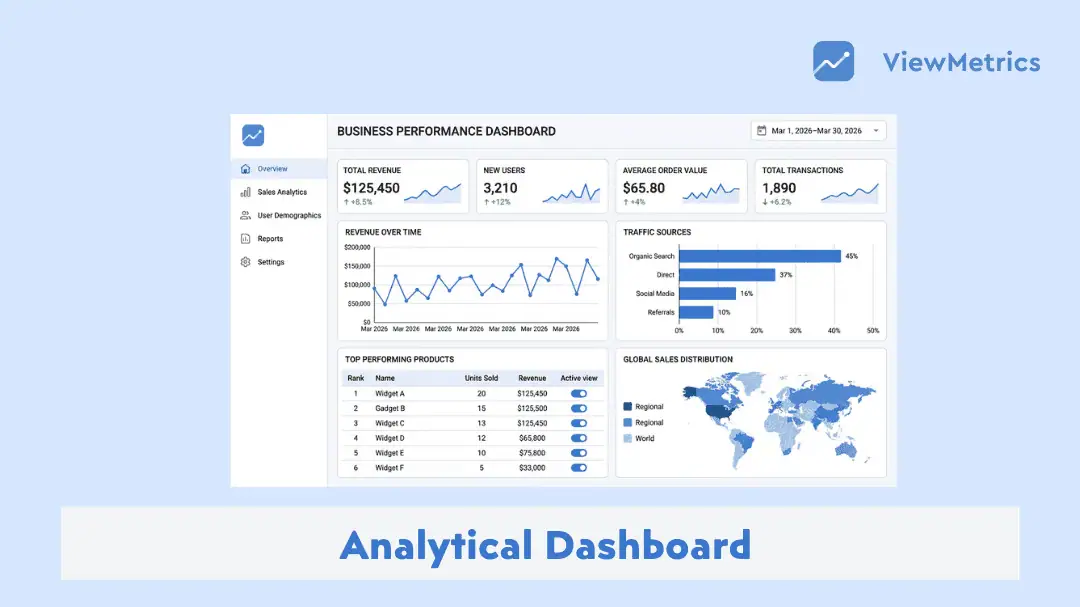
An analytical dashboard is a visual interface that brings together data from different sources and presents it in a way that is easy to understand. Instead of going through spreadsheets or reports, you see charts, graphs, and summaries in one place.
The purpose is simple. Help you make sense of data without getting lost in it.
These dashboards are often used to track trends, compare performance over time, and spot patterns that might not be obvious in raw data. For example, instead of checking daily sales one by one, you can see how your sales have moved over the last month in a single view.
Most analytical dashboards are interactive. You can filter data, change time ranges, or focus on specific metrics depending on what you want to explore. This makes them useful for both quick checks and deeper analysis.
Read our complete guide: 4 Types of Dashboards Every Business Needs
What are the Benefits of Analytical Dashboards?
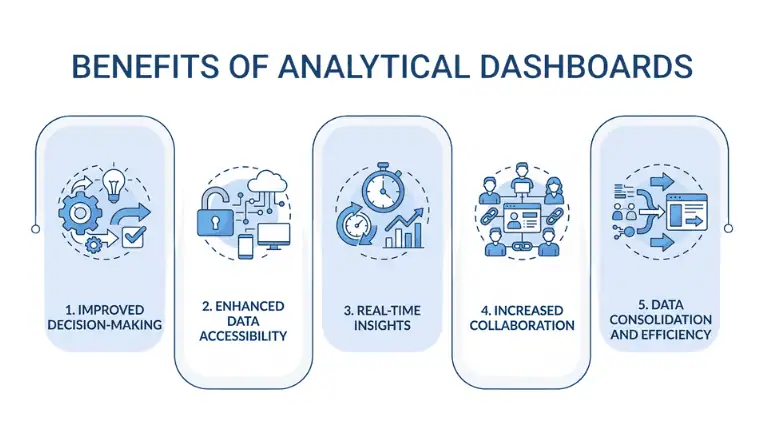
Analytical dashboards come with many benefits, such as:
-
Improved decision-making
When your data is clear, your decisions become more grounded. You are not relying on assumptions or partial information. You can see what is actually happening and respond with confidence.
For example, if a campaign is underperforming, you can identify the issue early and adjust your strategy promptly, rather than waiting for a full report at the end of the month.
-
Enhanced data accessibility
Data often lives in multiple tools. Marketing tools, CRM systems, finance software, and more. Without a dashboard, you are constantly switching between them.
A dashboard brings everything together. This reduces the effort required to find information, allowing teams to stay focused on analysis instead of data collection.
-
Real-time insights
Timing matters. If you are working with old data, your decisions will always lag behind reality.
Many analytical dashboards update automatically. This means you are looking at what is happening right now, not what happened days ago. Whether it is website traffic or sales activity, you stay in sync with what is actually going on.
-
Increased collaboration
When teams work with different data, discussions can go in circles. Everyone has a different version of the truth.
A shared dashboard fixes that. Everyone sees the same numbers. Conversations become clearer. Instead of debating the data, teams can focus on what to do next.
-
Data Consolidation and Efficiency
Without a dashboard, a lot of time goes into collecting and organising data. That effort does not directly add value.
When everything is already structured in a dashboard, you skip that step. You move straight to analysis and action. Over time, that saves hours of work and reduces small mistakes that happen during manual handling.
Key Features of an Effective Analytical Dashboard
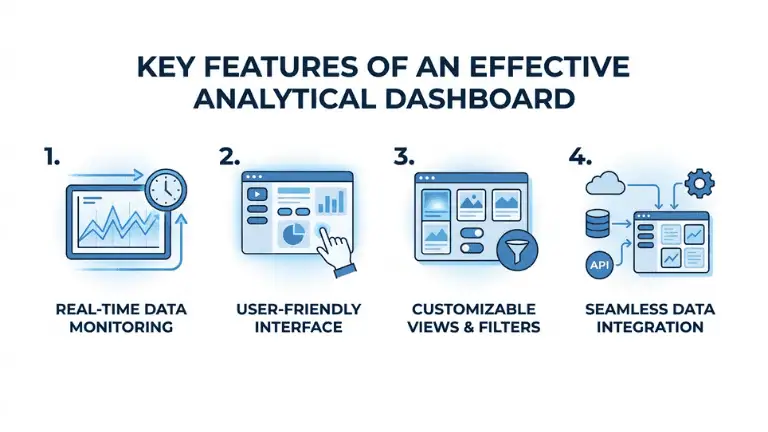
An analytical dashboard comes with features like:
-
Real-time data monitoring
A dashboard should not feel outdated. If the numbers do not reflect what is happening now, people stop trusting them.
Real-time or near-real-time updates help you stay connected to your business as it moves. Even if you are not constantly checking, you know the data is current when you open it.
-
User-friendly interface
This is where many dashboards fail.
They look impressive at first glance but are difficult to understand. Too many charts. Too many colours. No clear flow.
A good dashboard feels simple. You should be able to open it and understand the main story within a few seconds. Labels should be clear. The layout should guide your eyes naturally from one section to another.
-
Customizable views and filters
Not everyone needs the same view.
A marketing manager might care about campaign performance. A founder might want a high-level overview. A product team might focus on user behaviour.
Custom filters allow each person to adjust the dashboard without changing the core setup. This keeps things flexible without making it messy.
-
Seamless data integration
Most businesses use multiple tools. If your dashboard cannot connect to them properly, it becomes incomplete.
Good dashboards pull data from different sources and bring it together in a way that makes sense. You do not have to think about where the data is coming from. You just see the final picture.
How to Create an Analytical Dashboard?
Here’s how you can create an analytical dashboard:
-
Define the audience and objectives
Before you start building anything, take a step back. Who is this dashboard for? What decisions should it support?
If you skip this step, you will end up adding too much or focusing on the wrong things. That usually leads to clutter. A focused dashboard always starts with a clear purpose.
-
Choose the right KPIs
It is tempting to track everything. More numbers feel like more control.
In reality, too many KPIs create noise.
Pick metrics that actually reflect performance. For example, instead of tracking ten different marketing numbers, you might focus on conversions, cost per acquisition, and traffic quality.
Less, but meaningful, works better.
Read our complete guide: What Is KPI? Types, Examples & How to Track KPIs Effectively.
-
Connect and prepare your data
This is the part people often rush through. Data needs to be clean and consistent before it goes into a dashboard.
If your data has errors, duplicates, or gaps, your dashboard will reflect that. Spend time here. It saves you trouble later.
-
Design for clarity and action
When you start designing, think like a user, not a designer.
What should they notice first? What question should the dashboard answer?
Arrange your visuals in a way that tells a story. Keep it simple. Avoid overloading the screen. If something does not add value, remove it.
-
Add interactivity
Once the basics are in place, think about how people will explore the data.
A static dashboard works for quick viewing, but interactivity is what makes it useful day to day. Filters, dropdowns, and clickable charts let users dig deeper without needing a new report every time.
For example, instead of creating separate dashboards for each region, you can add a filter that lets users switch between regions instantly. Small additions like this make the dashboard feel more flexible.
-
Automate and share
Manually updating dashboards defeats the purpose.
Set up automatic data refresh so your dashboard stays up to date without extra effort. Most modern tools allow you to schedule updates or sync data in real time.
Sharing is just as important. A dashboard should not sit with one person. Make sure your team can access it easily, whether through a link, login, or embedded view.
-
Test, iterate, and govern
Once your dashboard is live, the work is not done.
Watch how people use it. Are they ignoring certain sections? Are they asking questions the dashboard does not answer?
Use that feedback to improve it. Remove what is not useful. Adjust what is confusing. Add what is missing.
At the same time, set some structure. Decide who can edit the dashboard, how often it should be reviewed, and how data sources are maintained. This keeps things consistent as your data grows.
Use Cases of Analytical Dashboards
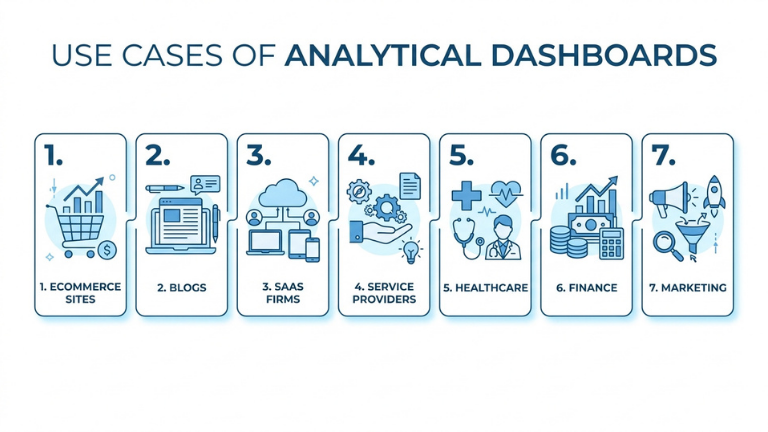
Here’s a closer look at the use cases of analytical dashboards:
-
Ecommerce sites
If you run an ecommerce business, you deal with constant movement. Orders, returns, product views, traffic sources.
A dashboard helps you track which products are selling, which ones are slowing down, and where your customers are coming from. You can also spot patterns, like whether certain products perform better during specific times.
-
Blogs
Content performance is not always obvious. Some posts bring steady traffic over time, while others spike and fade.
A dashboard helps you see patterns. Which topics work? How users engage. Where your traffic is coming from. That insight helps you plan better content.
-
SaaS firms
In SaaS, usage matters as much as signups.
Dashboards help track how often users log in, which features they use, and when they stop using the product. This gives early signals about churn and helps teams improve the product experience.
-
Service providers
Service-based businesses rely on leads and referrals. Knowing where those leads come from can shape your entire strategy.
Dashboards help you track sources, conversions, and client trends. This gives clarity on what is actually bringing in business.
-
Healthcare
In healthcare, data needs to be clear and reliable. Dashboards help track patient data, treatment outcomes, and operational efficiency.
This supports faster decisions and better coordination across teams.
-
Finance
Finance dashboards bring together revenue, expenses, and cash flow in one view.
This makes it easier to understand where money is coming from, where it is going, and how stable things are over time.
-
Marketing
Marketing teams rely heavily on dashboards.
Campaign performance, user acquisition, engagement, conversions. Everything can be tracked in one place. This helps teams adjust campaigns faster instead of waiting for end-of-month reports.
Read our complete guide: What Is a Marketing Dashboard and How to Create One?
Common Pitfalls to Avoid
While analytical dashboards are useful, there are some common pitfalls to be mindful of:
-
Data accuracy and trust
If people do not trust the data, they will stop using the dashboard.
Even small inconsistencies can create doubt. That is why it is important to ensure your data sources are reliable and updated regularly.
-
KPI sprawl
It is very easy to overdo dashboards. You start with a few metrics, then keep adding more because everything feels important.
The result is a cluttered screen where nothing stands out.
A better approach is to stay selective. Focus on what actually helps you take action. If a metric does not influence decisions, it probably does not need to be there.
-
One-size-fits-all layouts
Different users have different needs. A single dashboard for everyone may not work well. Consider creating tailored views.
-
User adoption
Sometimes dashboards are built well, but still not used.
This usually happens when they are too complex or not aligned with daily work. Keep things simple and relevant so people actually come back to it.
-
Performance and maintenance
As your data grows, dashboards can become slower or harder to manage.
Regular checks, updates, and small improvements keep them running smoothly. Ignoring this part often leads to dashboards that feel outdated or unreliable.
Tools to Create an Analytical Dashboard
There are quite a few tools out there, and each one approaches dashboards a little differently. The right choice usually depends on how simple or advanced you want your setup to be.
-
ViewMetrics
If you are looking for something that feels straightforward from day one, ViewMetrics stands out.
It is built with the idea that dashboards should not feel complicated. You can connect your data sources, set up dashboards, and start seeing insights without going through a steep learning curve.
What makes it practical is how it balances simplicity with flexibility. You can customise views, apply filters, and share dashboards across teams without needing technical support.
For businesses that want clarity without spending weeks setting things up, ViewMetrics feels like a natural fit.
<VMCTA1 />
-
Google Analytics
Google Analytics is widely used for tracking website performance. It gives detailed insights into traffic, user behaviour, and conversions.
It works well if your focus is primarily on web data, though it can feel a bit overwhelming for new users.
-
Tableau
Tableau is known for its strong visualisation capabilities. It allows deep analysis and highly customised dashboards.
It is powerful, but it comes with a learning curve. It suits teams that need detailed exploration and are comfortable spending time on setup.
-
Microsoft Power BI
Power BI integrates well with Microsoft tools and is commonly used in business environments.
It offers strong reporting and data modelling features, making it a solid choice for organisations already using the Microsoft ecosystem.
-
Explo
Explo is often used by companies that want to embed dashboards into their own products.
It focuses more on customisation and developer control, which makes it useful for product teams rather than general business users.
Closing Thoughts
At the end of the day, an analytical dashboard is not about charts or visuals. It is about clarity.
It helps you step back and see what is actually happening instead of relying on scattered information. When used properly, it changes how decisions are made. Things become less reactive and more intentional.
You do not need the most advanced setup to get started. Even a simple dashboard that tracks the right metrics can make a noticeable difference.
Over time, as your data grows and your needs change, your dashboard will evolve with it. The important part is starting with something that people will actually use.
Frequently Asked Questions (FAQs)
-
How often should businesses update their analytics dashboards?
Businesses should update their analytics dashboards as often as new data becomes available. In most cases, daily or weekly updates are enough, depending on how frequently decisions need to be made.
-
Can dashboards show real-time data, or are they updated periodically?
Dashboards can do both. Some show real-time data like live traffic or sales activity, while others update at fixed intervals to track trends over time. It depends on how the data is connected and what the dashboard is meant for.
-
Can small businesses benefit from using analytics dashboards?
Yes, small businesses can benefit a lot from dashboards. They make it easier to track progress, understand what is working, and make better decisions without needing complex systems.
-
Do I need technical or coding skills to set up an analytics dashboard?
No, many modern tools are designed to be easy to use. You can set up and manage dashboards without coding, especially with platforms that focus on simplicity and guided setup.
Related Posts
-
Learn what a tactical dashboard is. Discover the benefits, types, key features, and how to…
-
A strategic dashboard is a tool that gives you a clear, high-level view of how…
-
An operational dashboard is a tool that shows live or near-real-time data related to daily…
-

Understand what marketing dashboards are, how they work, and why they are valuable for driving…
-

Creating an analytical report can be a pain most of the time. With the workload…