
Key Takeaways
- A content marketing report shows how your content performed across traffic, engagement, conversions, SEO, and audience behavior.
- Clear reporting helps you identify what’s working, improve ROI, refine your strategy, and make better content decisions.
- You should include key elements such as a summary, content output, performance metrics, engagement insights, conversions, SEO results, and future recommendations.
- The easiest way to create a report is to define KPIs, gather data, visualize trends, explain what the numbers mean, and end with clear next steps.
- Tools like ViewMetrics, Databox, Semrush, Google Analytics, and BuzzSumo streamline reporting by consolidating all your performance data in one place.
Your content marketing efforts only work when you measure what’s actually driving results. And that’s exactly where a content marketing report comes in. It helps you understand what’s working, what isn’t, and where to invest your time next. In this guide, we’ll walk through how to build a clear, data-driven report that your team or clients can instantly understand.
What is a Content Marketing Report?
A content marketing report is a structured summary of how your content performed across different channels. It tracks key metrics like traffic, engagement, conversions, SEO growth, and audience behavior to help you understand whether your content strategy is meeting your goals. It pulls data from analytics tools, social platforms, email dashboards, and SEO trackers to give you a complete view of your performance over a set period, which is usually weekly, monthly, or quarterly.
The goal is simple: help you make smarter, data-backed decisions without guesswork.
Why Do You Need a Content Marketing Report?
With the help of a content marketing report, you can better understand whether your strategy is working and dive into improving it at the right time. Here’s why it’s essential:
- Identify What’s Working: Content marketing reports allow marketers to see which content drives results and which pieces need updates or replacement.
- Optimize Performance: Performance trends help you adjust your content calendar, keywords, and formats based on what audiences prefer.
- Improve ROI: You can see which content brings the highest conversions or engagement with measurable insights, guiding your investment.
- Align Marketing & Sales Goals: Clear reports make it easier to connect content with leads, MQLs, or SQLs, ensuring both teams stay aligned.
- Drive Continuous Growth: Regular reporting helps refine your strategy, test new formats, and adapt based on real user behavior.
What is Included in a Content Marketing Report?
A good report should be concise, easy to scan, and aligned with your goals. Here’s what every strong report must contain.
-
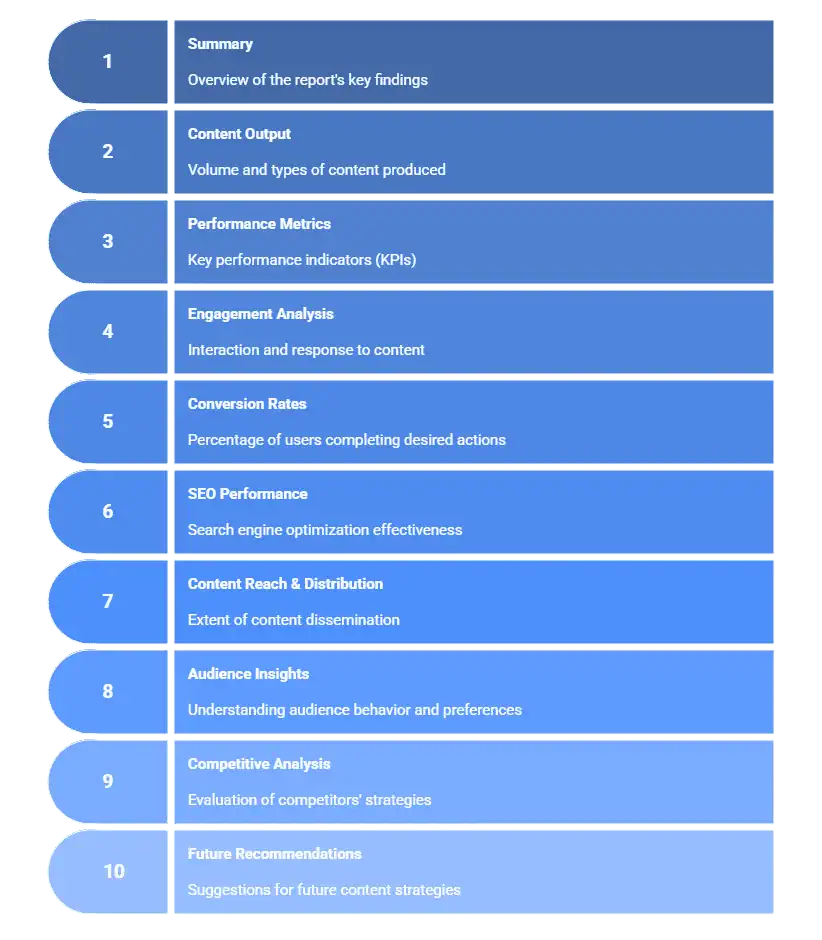
Summary
Start your content marketing report with a short overview of what happened during the campaign. Highlight wins, challenges, unusual spikes or drops, and a quick explanation of what changed.
-
Content Output
List what was created and published. Include blogs, videos, emails, social posts, landing pages, and downloadable assets. In short, every content piece that was in your marketing plan. This helps connect production effort with performance.
-
Performance Metrics
Share high-level metrics, such as website sessions, page views, impressions, clicks, or reach. These numbers show whether visibility and traffic are trending up or down.
-
Engagement Analysis
This element in your content marketing report explains how users interacted with your content. The key metrics to check are average time on page, scroll depth, bounce rate, and social engagement. They reveal whether your content is relevant and helpful to your audience.
-
Conversion Rates
Cover key conversion actions such as form fills, downloads, demo requests, sign-ups, or purchases. This is where you can show the stakeholders what kind of business outcomes your content marketing efforts are bringing, both positive and negative.
-
SEO Performance
Ensure your content marketing report includes the overall SEO performance of the content. This includes metrics like organic traffic, keyword rankings, backlinks, and SERP presence. They show long-term content growth and your visibility in search results.
-
Content Reach & Distribution
Explain where and how your content traveled through key metrics like social reach, email send performance, shares, or referral traffic. This helps you understand the distribution effectiveness of your content.
-
Audience Insights
This important element in your content marketing report breaks down who engaged with your content. Include demographics, user segments, devices, geographies, or top landing pages to help refine future targeting.
-
Competitive Analysis
Compare your performance with competitors using keyword visibility, ranking trends, domain authority, or social presence. This highlights opportunities or threats.
-
Future Recommendations
Lastly, end your content marketing report with future recommendations that contain 3 to 5 simple, actionable next steps. Focus on what to improve next and not just what happened in the past.
Best Content Marketing KPIs to Track
How to Create a Content Marketing Report?
A solid report is built on clarity, consistency, and data that tells a story. Here’s how to structure it step-by-step.
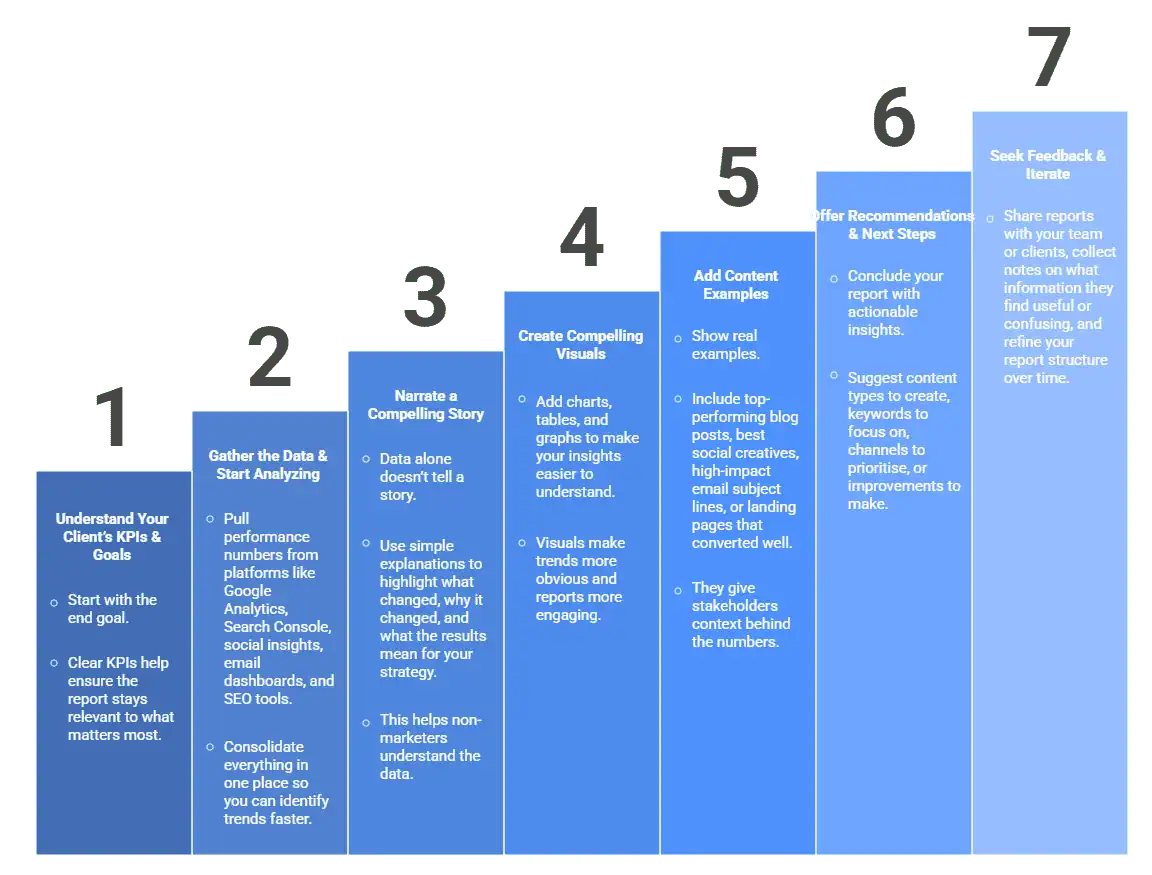
Step 1: Understand Your Client’s KPIs & Goals
Start with the end goal. Identify whether the focus is awareness, engagement, leads, or conversions. Clear KPIs help ensure the report stays relevant to what matters most.
Step 2: Gather the Data & Start Analyzing
Pull performance numbers from platforms like Google Analytics, Search Console, social insights, email dashboards, and SEO tools. Consolidate everything in one place so you can identify trends faster.
Step 3: Narrate a Compelling Story
Data alone doesn’t tell a story. Use simple explanations to highlight what changed, why it changed, and what the results mean for your strategy. This helps non-marketers understand the data.
Step 4: Create Compelling Visuals
Add charts, tables, and graphs to make your insights easier to understand. Visuals make trends more obvious and reports more engaging.
Step 5: Add Content Examples
Show real examples. Include top-performing blog posts, best social creatives, high-impact email subject lines, or landing pages that converted well. They give stakeholders context behind the numbers.
Step 6: Offer Recommendations & Next Steps
Conclude your report with actionable insights. Suggest content types to create, keywords to focus on, channels to prioritise, or improvements to make.
Step 7: Seek Feedback & Iterate
Share reports with your team or clients, collect notes on what information they find useful or confusing, and refine your report structure over time.
Also Read: Content Marketing Analytics
Best Tools to Create a Content Marketing Report
The right tools make reporting faster, accurate, and easier to scale. Here are some of the most reliable options:
1. ViewMetrics
ViewMetrics lets you automate your content marketing report using real-time data pulled directly into Google Sheets, Slides, or Docs. You can connect multiple marketing platforms, sync KPIs, and generate reports in minutes instead of hours. It’s perfect for teams who want simple, automated reporting without extra dashboards.
| Aspects | Details |
| Features | – Automated data sync – Ready-to-use templates- Google Workspace add-on- Customizable dashboards |
| Reporting Formats | Sheets, Slides, Docs, embeds |
| Strengths | Easy automation and multi-source integration |
| Pricing | – Free plan available
– Starter: $19/month – Professional: $39/month – Team: $99/month |
| Best For | Agencies and teams managing multiple content channels. |
Try ViewMetrics for Free
2. Databox
Databox is a dashboard tool that centralizes your KPIs on one screen. It’s great for visual reporting, especially if your team tracks performance daily or weekly.
| Aspects | Details |
| Features | – Pre-built dashboards- Goal tracking
– Alerts |
| Reporting Formats | Dashboards, scorecards, PDF exports |
| Strengths | Strong visualization and wide integration support |
| Pricing | – Free trial available- Professional: $159/month
– Growth: $399/month – Premium: $799/month |
| Best For | Teams that rely heavily on dashboards. |
3. Semrush
Semrush provides deep SEO insights, keyword tracking, content audits, and competitive analysis. It’s ideal for understanding organic growth.
| Aspects | Details |
| Features | – Keyword tracking- Content audit
– Competitor insights |
| Reporting Formats | PDF reports, dashboards |
| Strengths | Excellent for SEO-focused reporting |
| Pricing | – Starter: $165.17/month- Pro+: $248.17/month
– Advanced: $455.67/month |
| Best For | SEO teams and content strategists. |
4. Google Analytics 4
Google Analytics 4, or GA4, helps you measure traffic, conversions, and user behavior with event-based tracking. It’s essential for understanding how people interact with your content.
| Aspects | Details |
| Features | – Traffic analysis- Events tracking
– Conversion tracking |
| Reporting Formats | Explore reports, dashboards |
| Strengths | Free and powerful for website performance |
| Pricing | Free |
| Best For | SEO teams and content strategists. |
5. BuzzSumo
BuzzSumo helps you discover top-performing content across the web. It’s ideal for analyzing trends, competitor topics, and high-engagement formats.
| Aspects | Details |
| Features | – Content discovery- Topic research
– Influencer tracking |
| Reporting Formats | Content reports, exports |
| Strengths | Great for analyzing content ideas and social performance |
| Pricing | – Content Creation: $159/month- PR & Comms: $239/month
– Suite: $399/month – Enterprise: $999/month |
| Best For | Content creators and social teams. |
Conclusion
A strong content marketing report gives you clarity, confidence, and direction. It shows what’s working, what needs improvement, and where to focus next. With the right tools and a clear structure, reporting becomes easier and far more impactful.
Automate your reporting and build content insights that drive better results.
Frequently Asked Questions (FAQs)
-
How often should I create a content marketing report?
Creating content marketing reports monthly or quarterly is ideal, depending on your campaign length and goals. Frequent reporting helps you identify patterns early and take timely action.
-
How can I make my report easier for non-marketers to understand?
Use visuals, short summaries, and simple explanations. Focus less on raw data and more on what the numbers actually mean.
-
What should I highlight about top-performing content?
Showcase what brought traffic, engagement, or conversions. Explain why it performed well and how you can replicate the results.
-
What common mistakes should I avoid in content marketing reporting?
Avoid data overload, skipping insights, and not updating goals or KPIs regularly. Keep reports focused and actionable.
-
Should I include ROI in my content marketing report?
Yes. ROI shows whether your content investments are generating meaningful outcomes and helps with future budgeting. So, it’s important to include it in your content marketing report.
-
What mistakes should I avoid in a content marketing report?
Avoid too much data without insights, ignoring engagement metrics, using confusing visuals, and skipping actionable recommendations for the most impactful reports.
Related Posts
-

{ “@context”: “https://schema.org”, “@type”: “BlogPosting”, “mainEntityOfPage”: { “@type”: “WebPage”, “@id”: “https://www.viewmetrics.com/blog/monthly-marketing-report” }, “headline”: “How To…
-

{ “@context”: “https://schema.org”, “@graph”: [ { “@type”: “ItemList”, “name”: “Types of Content”, “itemListElement”: [ {…
-

{ “@context”: “https://schema.org”, “@type”: “BlogPosting”, “mainEntityOfPage”: { “@type”: “WebPage”, “@id”: “https://www.viewmetrics.com/blog/end-of-year-marketing-report” }, “headline”: “How To…
-

Marketing successfully while on a tight budget can be tough! Thankfully, organic marketing serves as…
-

A digital marketing report is more than a collection of numbers; it’s a clear summary…