
Tracking digital marketing performance across multiple platforms can be time-consuming and confusing. Jumping between Google Analytics, Meta Ads, and email dashboards often leads to scattered data and missed insights. That’s why digital marketing reporting tools are important. These tools collect all your campaign data in one place, helping you save time, analyze performance, and make smarter marketing decisions.
In this blog, we’ll explore some of the best digital marketing reporting tools that can help you automate reports, visualize key metrics, and present results clearly to clients or teams. Whether you’re a freelancer, agency, or in-house marketer, these tools can simplify your workflow and give you the clarity you need to focus on what truly matters: growing your business.
Best Digital Marketing Reporting Tools in 2026
With numerous reporting platforms available, selecting the right one depends on your business size, goals, and budget. Below are some of the best digital marketing reporting tools that simplify data tracking, automate reporting, and help marketers make data-driven decisions effortlessly.
| Tool | Key Features | Pricing |
| ViewMetrics | Simple automation, multi-channel dashboards, customizable templates, flexible data syncing, and Google Workspace add-on support for Sheets, Slides, and Docs. | Get started for FREE |
| Tableau | Powerful data visualizations, advanced analytics, and compatibility with large data sources for complex business insights. | Tableau Viewer: $15/month/user
Tableau Explorer: $42/month/user Tableau Creator: $75/month/user |
| Power BI | Integrated with Microsoft ecosystem, budget-friendly, robust dashboards, and built-in AI analytics for smarter insights. | $14.00 per user/month |
| Klipfolio | Highly customizable dashboards, extensive integrations, real-time data refresh, and strong agency support. | Agencies: $49/month (10 dashboards or clients)
Businesses: $99/month (15 dashboards, unlimited users) |
| Whatagraph | Automated reporting, clean templates, and built-in scheduling ideal for agencies managing multiple clients. | Essential: $249/month (5 users)
Advanced: $499/month (10 users) |
| Looker Studio (formerly Data Studio) | A free and widely used tool that seamlessly integrates data from multiple sources, featuring strong sharing and collaboration capabilities. | Free |
| Supermetrics | Large integration library, connects seamlessly with Google Sheets, Excel, and Looker Studio for quick data pulls. | €29/month |
| Cyfe | Affordable all-in-one dashboard with a variety of widgets, an intuitive interface, and quick setup. | Starter: $19/month
Standard: $29/month Pro: $49/month Premier: $89/month |
| NinjaCat | Designed for agencies, integrates PPC, social, and email data, with full white-label reporting for clients. | $799/month |
| Domo | Cloud-based enterprise analytics with extensive integrations and scalable architecture for big data management. | Free tier includes 300 credits/month; Premium pricing on request. |
| SEMrush | Advanced SEO and SEM reporting with keyword, competitor, and traffic analysis features. | Starting at $99/month |
| Ahrefs | Comprehensive SEO toolkit offering backlink tracking, keyword analysis, and performance insights. | $99/month |
| Sprout Social | Social media analytics, performance tracking, and content scheduling for agencies and brands. | Starting at $199/month |
| Reporting Ninja | Automated PPC, SEO, and social reports with good customization and template options. | €20/month |
| Hootsuite | Social media management platform with tracking, reporting, and client collaboration features. | $199/seat per month |
If you’re managing multiple platforms or clients, tools like ViewMetrics can save hours by automating your reports and syncing real-time data across channels, all in one dashboard.
15 Best Digital Marketing Tools in 2026
-
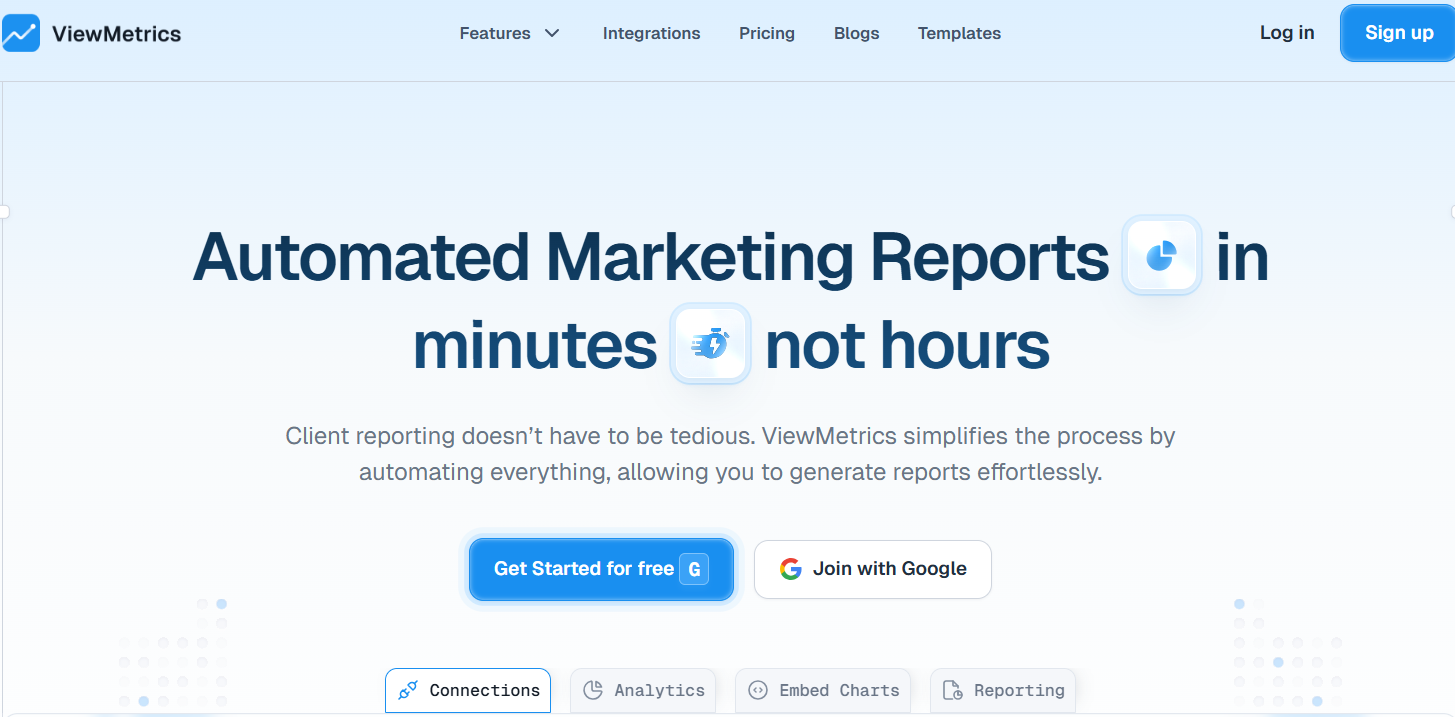
ViewMetrics
What it is:
ViewMetrics is one of the best digital marketing reporting tools there is. It is a streamlined tool that helps agencies and in-house teams ditch tedious monthly manual work. It consolidates data from ads, web analytics, email, and social channels, and uses a report template to deliver professional and polished information fast. With its Google Workspace integration and automation capabilities, it’s especially a great fit for teams that create client or stakeholder reporting regularly.
Key Features:
- Automated Reporting: Generates reports automatically, reducing manual work and ensuring timely insights.
- Data Integration: Connects with major platforms like Google Analytics, Facebook Ads, and email marketing tools for unified reporting.
- Customization: Allows users to build custom dashboards and templates aligned with specific goals and branding.
- Data Visualization: Offers clear charts and graphs that make complex data easy to understand.
- Tool Integration: Works smoothly with Google Sheets, Slides, and Docs for effortless data sharing and presentation.
-
Tableau
What it is:
Tableau is a good data visualization and analytics platform that helps users convert raw data into interactive insights with AI-powered automation and enterprise-level flexibility.
Key Features:
- Einstein AI & Tableau Pulse: Generate smart, contextual insights automatically for faster decision-making.
- Natural Language Queries: Ask questions in plain English using “Ask Data” to get instant visual answers.
- Rich, Interactive Dashboards: Combine visuals, filters, and live data for dynamic storytelling.
- Scalable Open Platform: Connect seamlessly across multiple data ecosystems and scale without added infrastructure.
- Enterprise Governance: Maintain trust with built-in data governance, SSO, and compliance support.
-
Power BI
What it is:
Power BI is Microsoft’s all-in-one business intelligence and data visualization platform that turns raw data into information you can use to improve. It empowers users to create interactive dashboards, check out trends, and make informed decisions with ease. Fully integrated with the Microsoft ecosystem, Power BI supports both individual users and enterprise level analytics seamlessly.
Key Features:
- Power Query & Data Modeling: Easily clean, transform, and shape complex datasets.
- Real-Time Dashboards: Monitor live data feeds for instant business insights.
- AI-Driven Analytics: Use AI visuals and Copilot to detect patterns and predict outcomes.
- Seamless Microsoft Integration: Natively works with Excel, Teams, Azure, and the Power Platform.
- Row-Level Security: Protect sensitive data through advanced role-based access.
-
Klipfolio
What it is:
Klipfolio is a cloud-based business intelligence platform that lets users build and automate real-time dashboards. It’s ideal for agencies, marketers, and analysts who need to look at flexible data and get automation without technical expertise.
Key Features:
- No-Code Dashboard Builder: Drag-and-drop interface for building custom dashboards.
- AI-Powered Insights: Automates KPI monitoring and provides AI summaries of trends.
- Cross-Source Data Blending: Merge data from multiple platforms like Google Analytics and Salesforce.
- White-Label Dashboards: Fully brandable reports for agencies and clients.
- Automated Scheduling: Deliver recurring updates and insights without manual intervention.
-
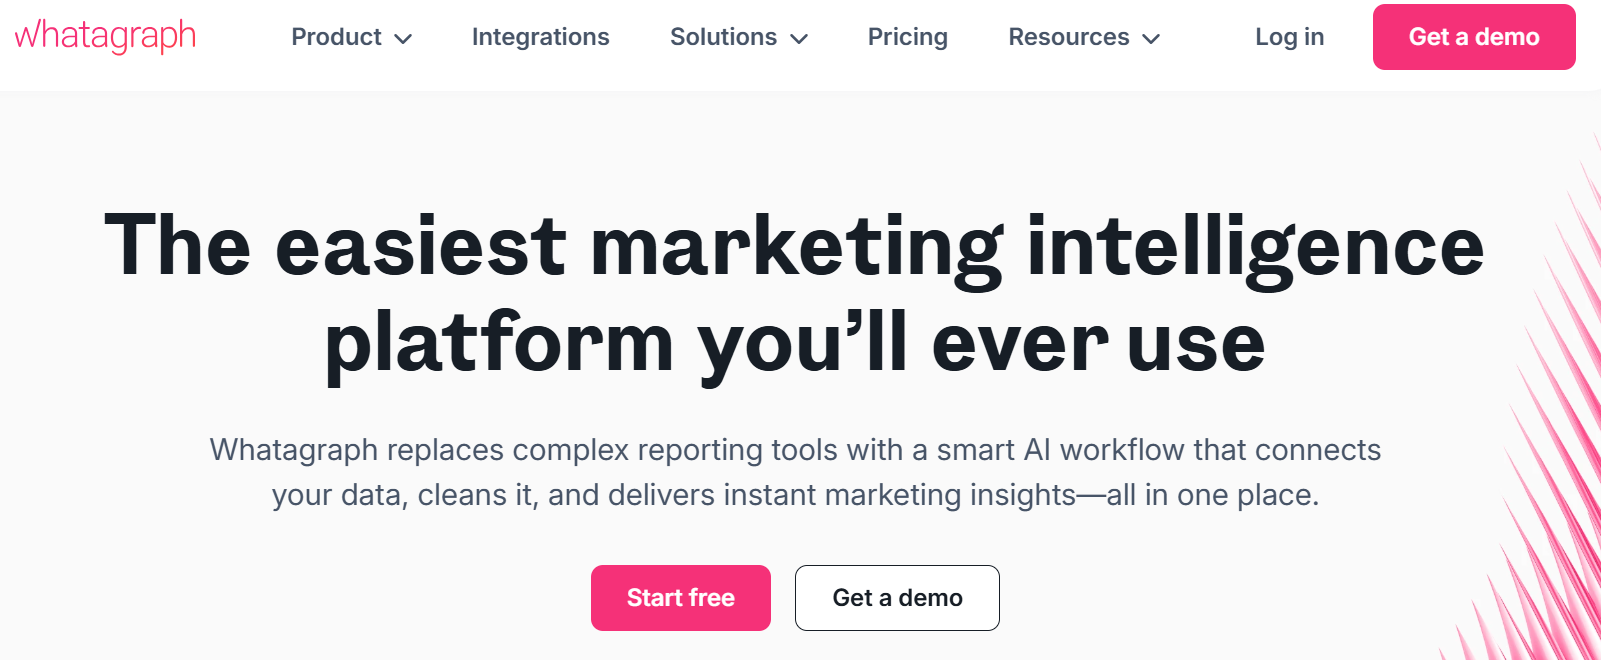
Whatagraph
What it is:
Whatagraph is an automated marketing reporting platform for agencies and in-house teams. It consolidates data from multiple sources into branded, visual reports that update in real time, saving hours on manual reporting.
Key Features:
- Automated Cross-Channel Reporting: Integrates with 40+ marketing platforms for unified analytics.
- White-Label Customization: Add your agency’s branding for professional client reports.
- Real-Time Data Sync: Keeps metrics current across all channels automatically.
- Goal & KPI Tracking: Visualize and compare performance against defined targets.
- Scheduled Report Delivery: Automate recurring client report distribution via email.
-
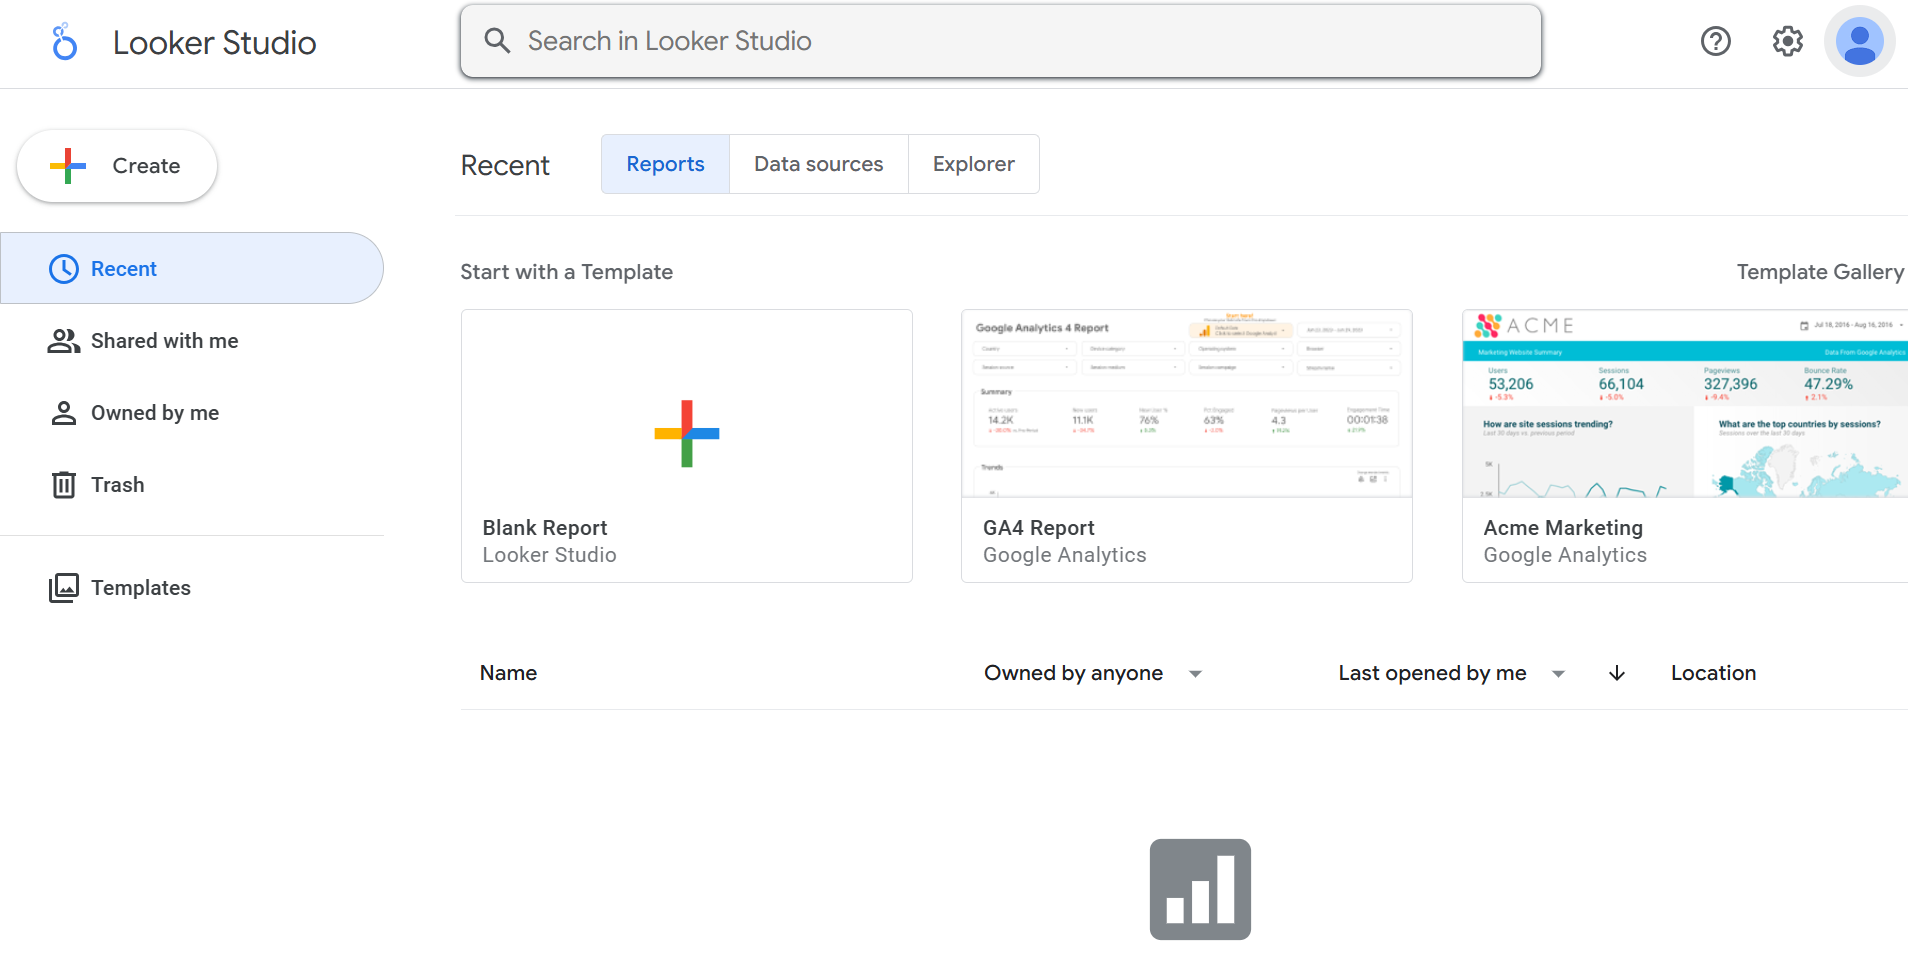
Looker Studio
What it is:
Looker Studio is Google’s free, cloud-based digital marketing reporting tool that helps users turn raw data into interactive dashboards and share information effortlessly. It’s built for marketers, analysts, and decision-makers looking for real-time and quick information.
Key Features:
- Real-Time Data Visualization: Build interactive dashboards with drag-and-drop ease.
- Data Blending: Combine multiple data sources for unified, contextual insights.
- Google Ecosystem Integration: Connect directly with Google Analytics, Ads, and Sheets.
- Live Collaboration: Co-edit, comment, and share securely with team access controls.
- Predictive Analytics Integration: Supports custom models for forecasting and advanced insights.
-
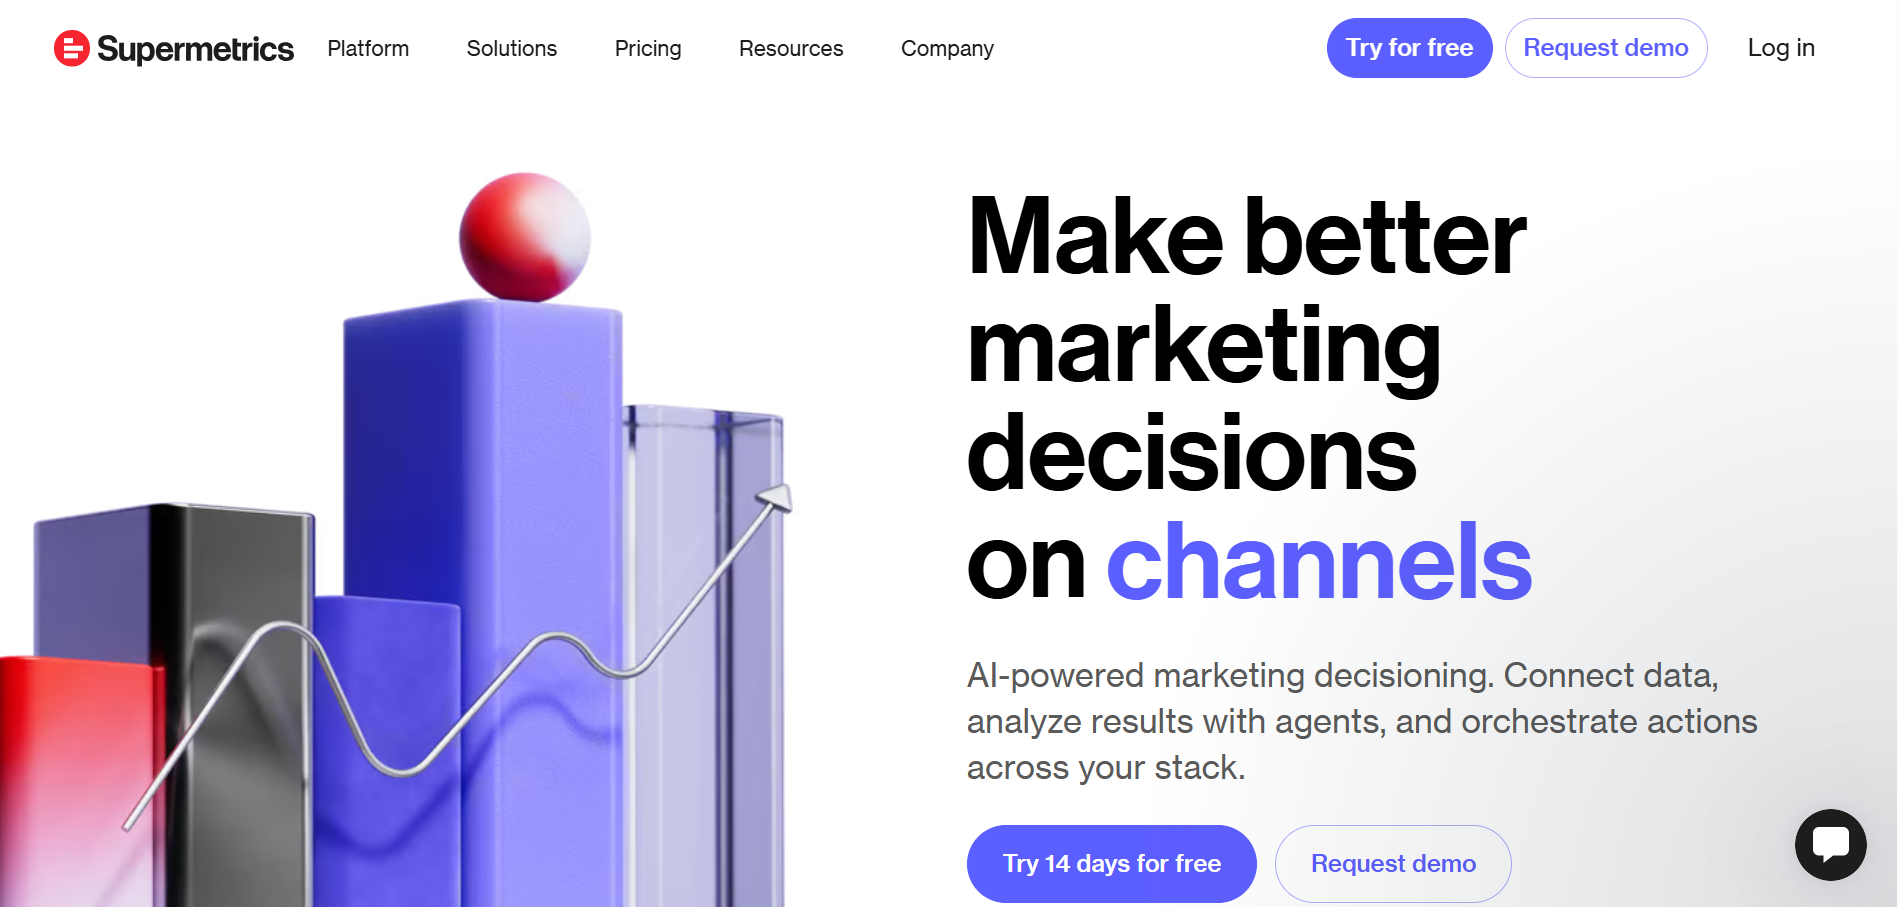
Supermetrics
What it is:
Supermetrics is a data integration and automation tool designed for marketers. It combines performance data from multiple platforms into Google Sheets, Excel, or BI tools, making reporting and trend analysis simple.
Key Features:
- Automated ETL (Extract, Transform, Load): Streamlines data movement from 100+ marketing platforms.
- Cross-Platform Performance Tracking: Consolidates campaign results across all channels.
- Real-Time & Historical Data: Enables live dashboards and long-term performance comparisons.
- ROI & Spend Analytics: Tracks ad spend and performance to optimize budgets.
- Google Workspace Integration: Works seamlessly with Sheets, Excel, and Looker Studio.
-
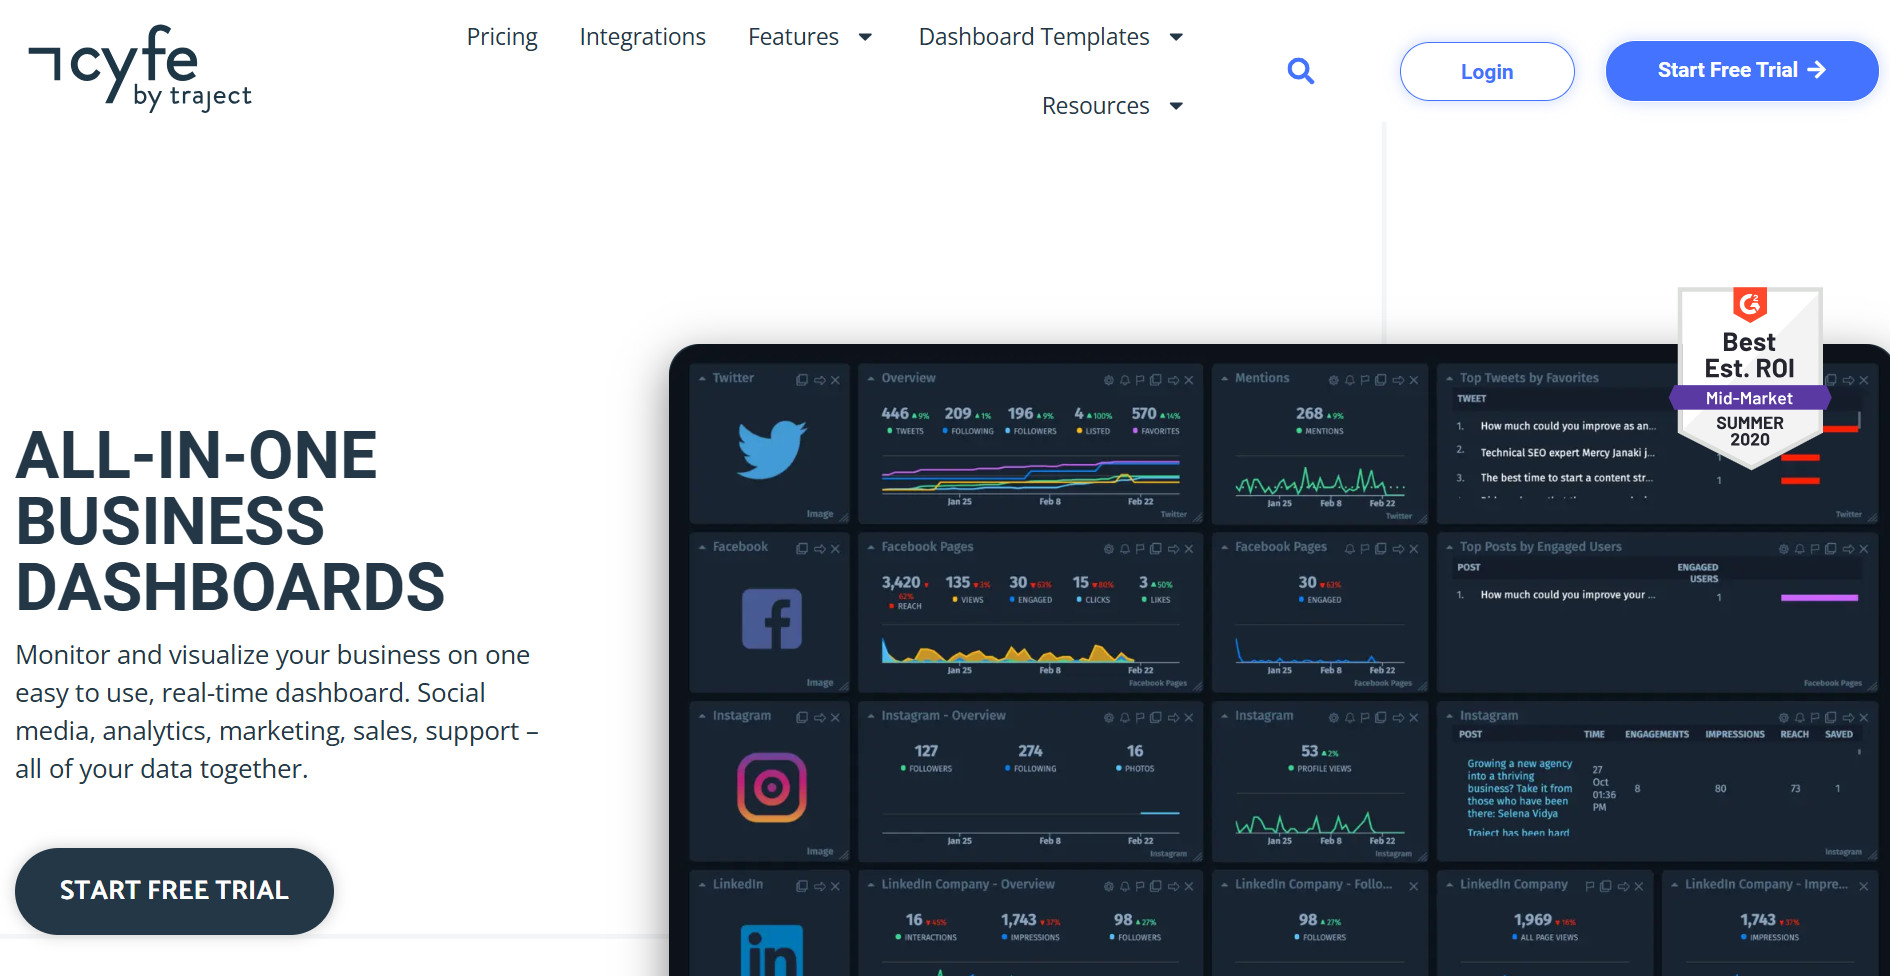
Cyfe
What it is:
Cyfe is an all-in-one business dashboard platform that helps organizations visualize KPIs from multiple sources as and when they need. It’s ideal for small and mid-sized businesses needing a combined analysis without complexity.
Key Features:
- All-in-One Dashboard: Aggregate marketing, sales, and finance data in one view.
- Customizable Widgets: Build personalized dashboards for specific goals.
- Real-Time Monitoring: Access live, automatically updated analytics.
- KPI Tracking & Alerts: Get notified instantly when metrics hit thresholds.
- Historical Data Benchmarking: Compare performance trends over time.
-
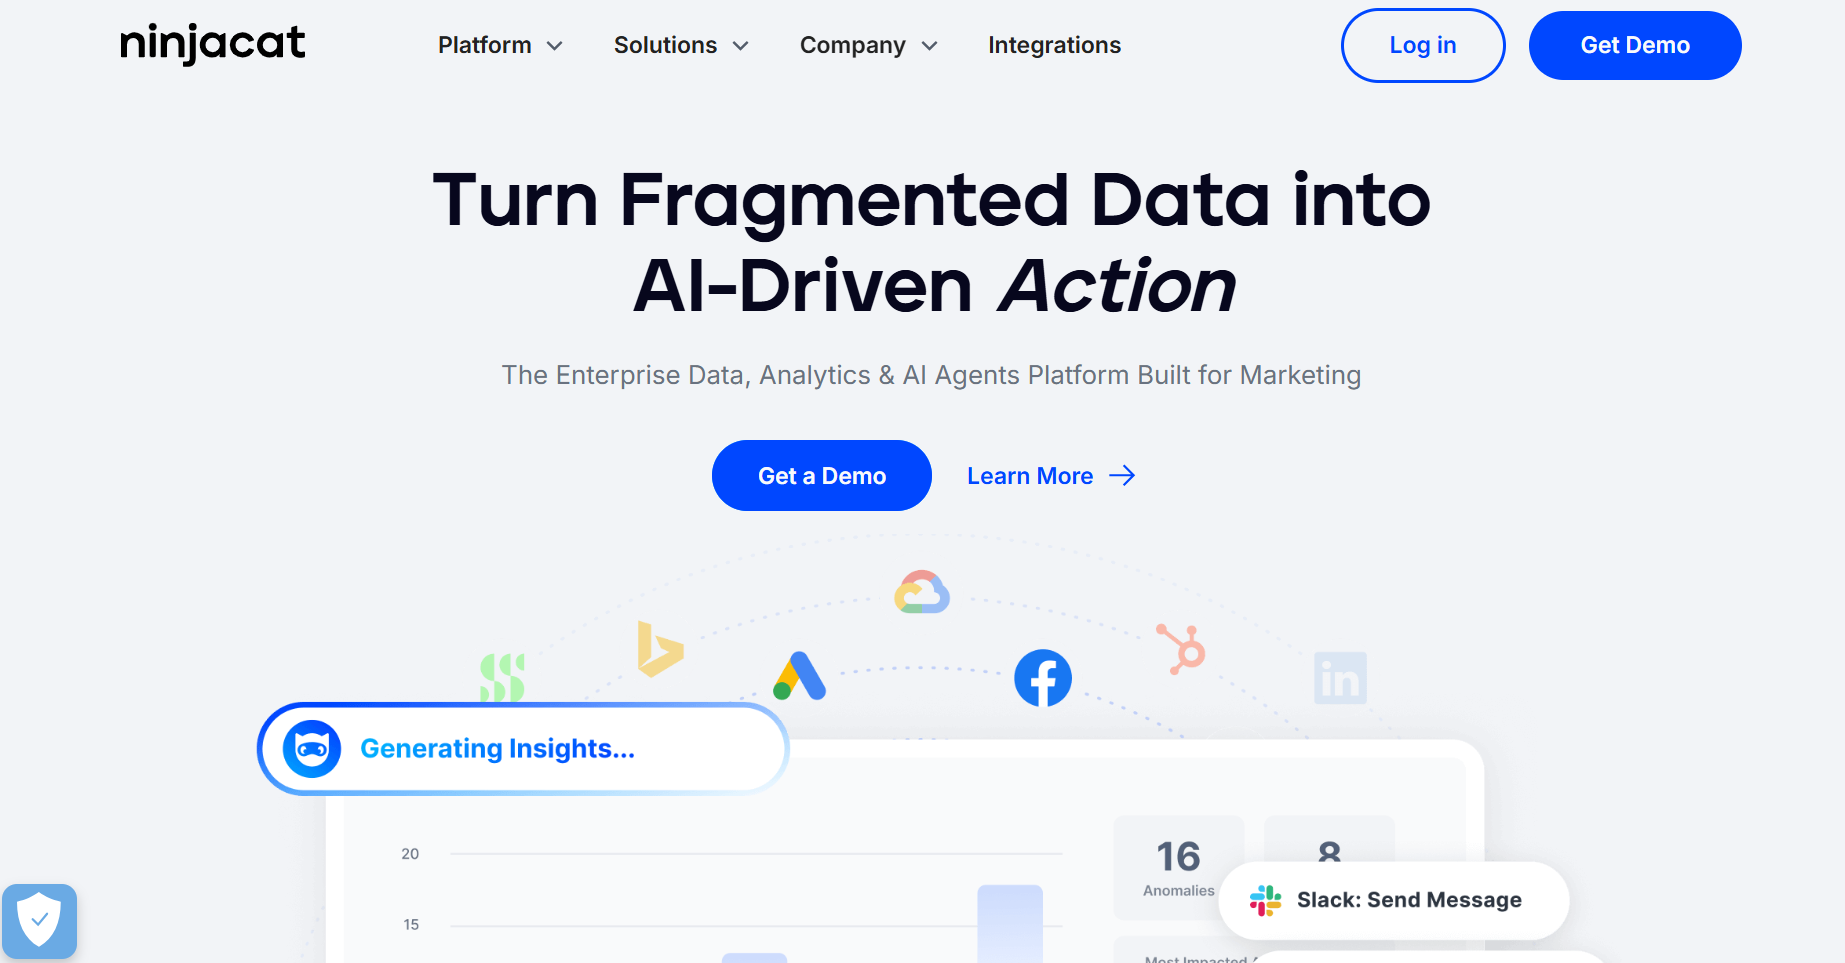
NinjaCat
What it is:
NinjaCat is a performance analytics and reporting platform built for marketing agencies. It collects data from multiple sources into automated, white-labeled dashboards and converts them into reports that are ready to be presented to clients.
Key Features:
- Unified Marketing Dashboard: Combine PPC, SEO, social, and call tracking data in one interface.
- White-Label Client Reports: Customize dashboards and branding for each client.
- Predictive Analytics: Generate forecasts using historical marketing data.
- Call Tracking & CRM Integration: Measure lead quality and ROI across campaigns.
- Automated Report Scheduling: Send recurring performance reports to clients automatically.
-
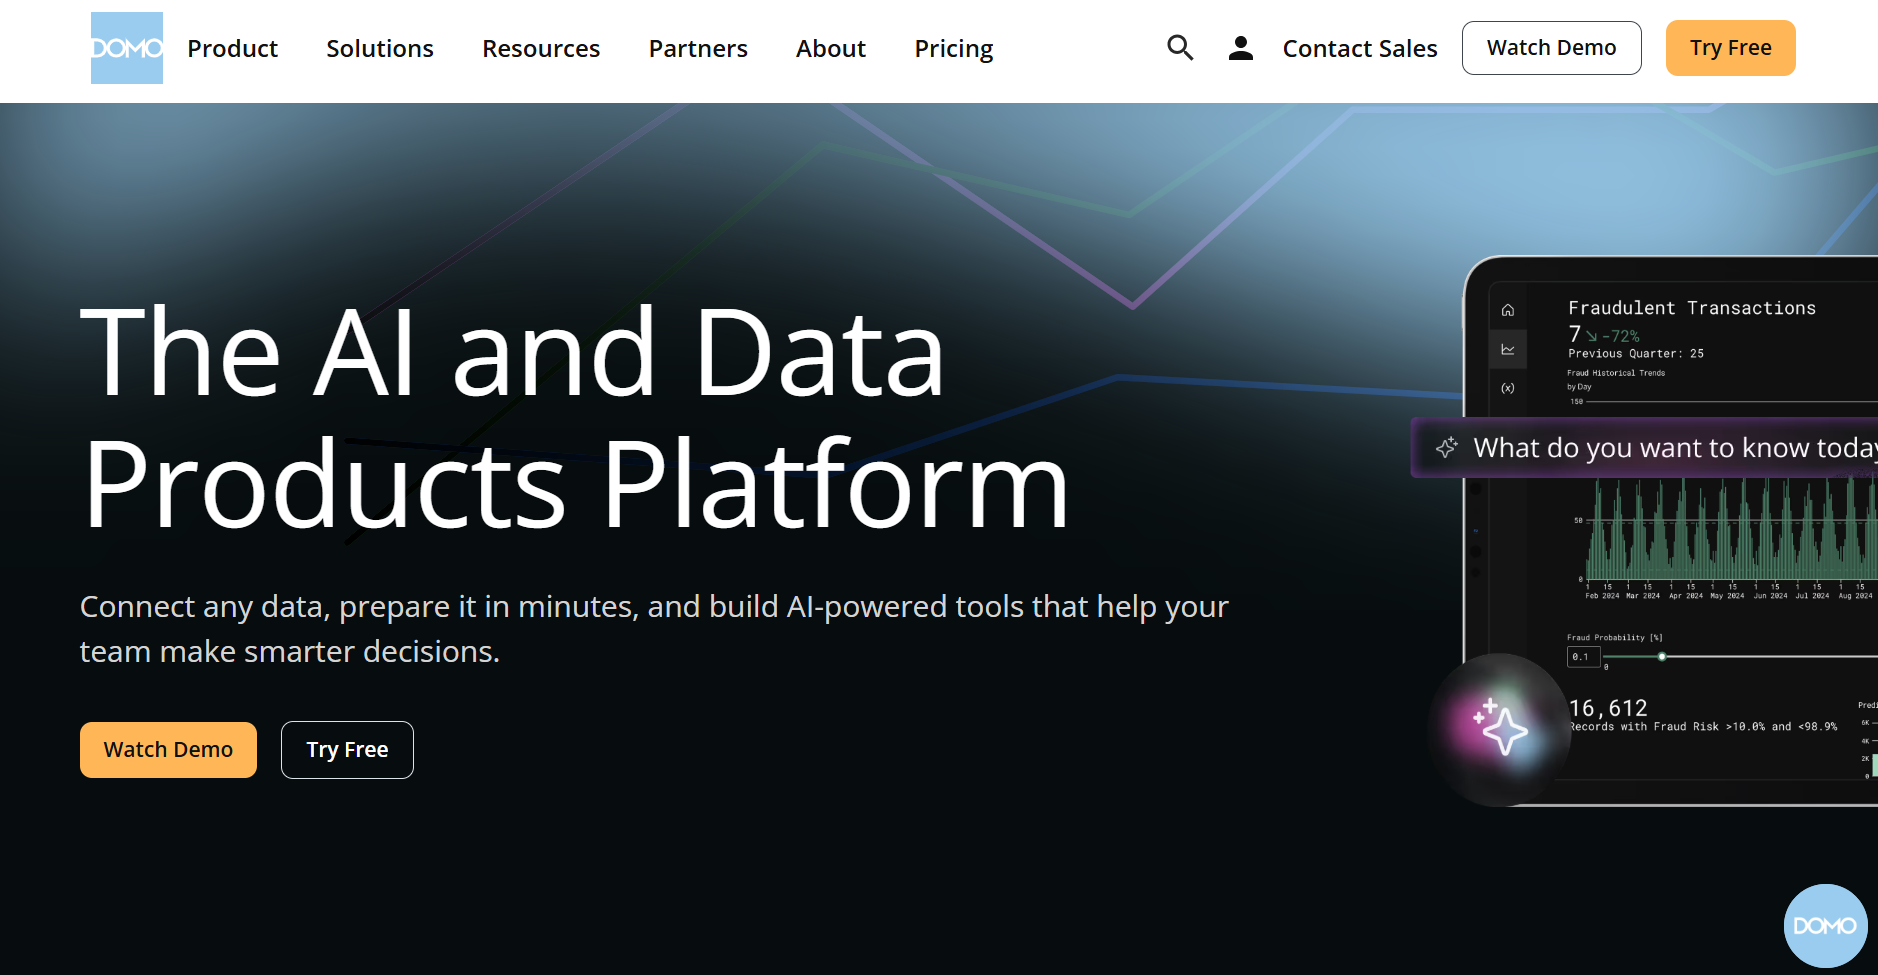
Domo
What it is:
Domo is a cloud-based business intelligence platform that merges data integration, visualization, and AI-driven analytics into one system, allowing teams to make immediate decisions when required.
Key Features:
- Domo.AI & Machine Learning: Automate insights and predictive analysis with integrated AI tools.
- Magic ETL: Clean and transform massive datasets using an intuitive drag-and-drop interface.
- Adrenaline Data Engine: Deliver ultra-fast querying and visualization on billions of rows.
- Real-Time Dashboards: Access 150+ chart types and 7,000+ custom maps for dynamic insights.
- Collaborative Analytics: Discuss, share, and act on insights using Domo Buzz and task tools.
-
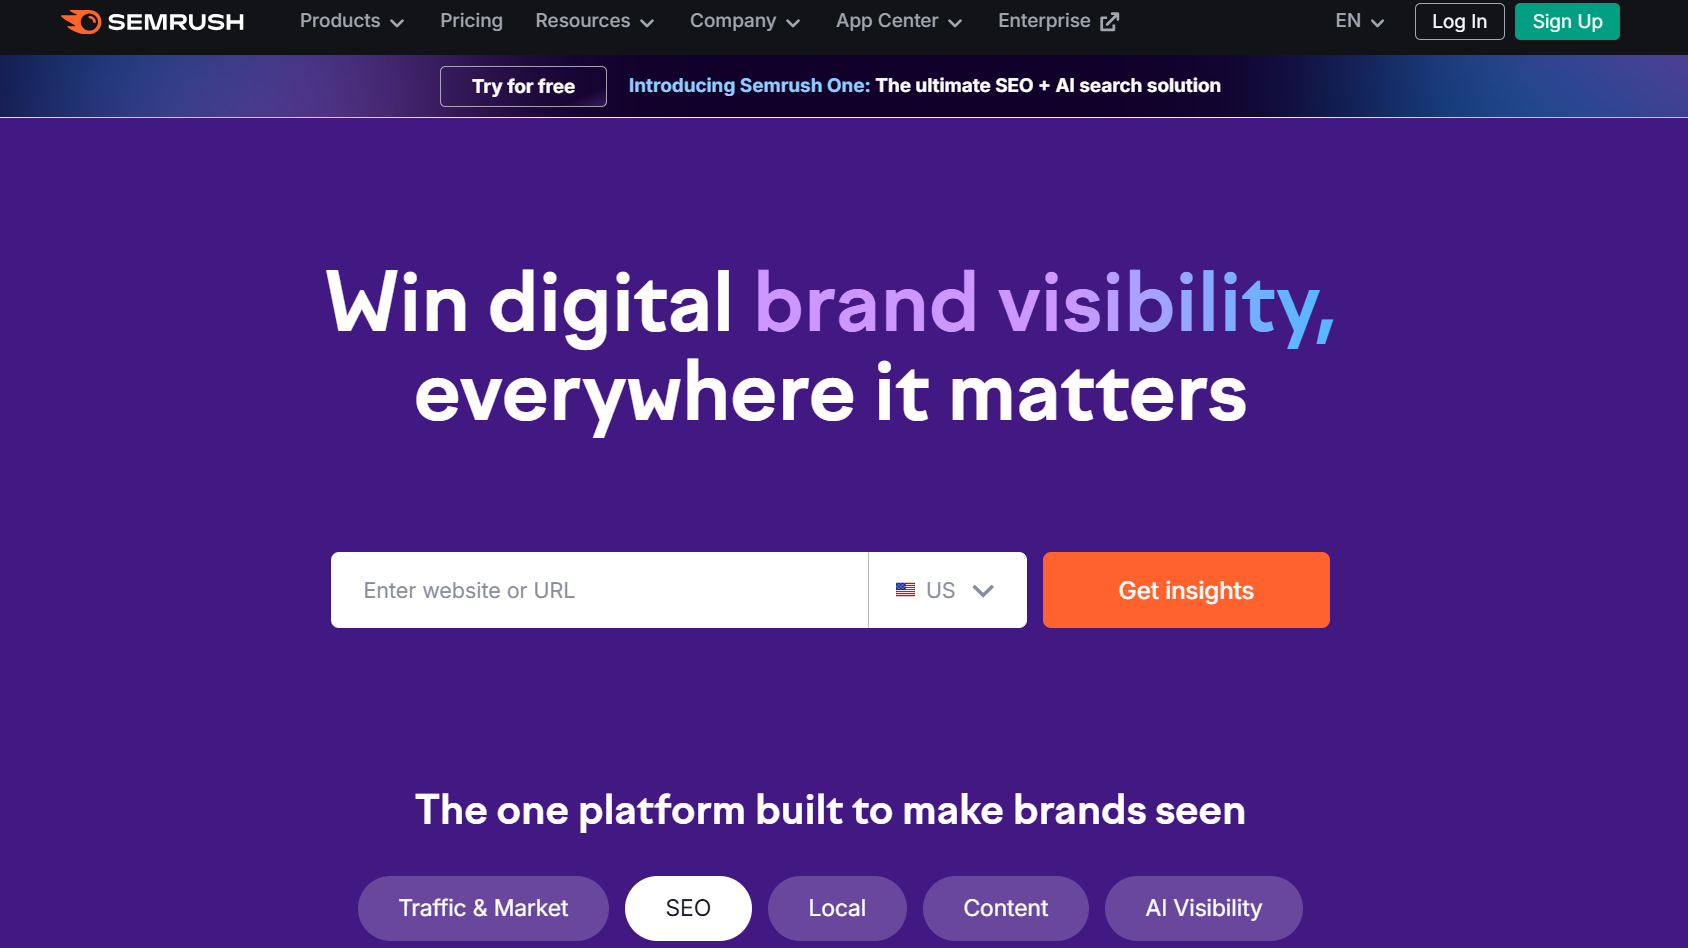
Semrush
What it is:
Semrush is a digital marketing platform that helps businesses improve their online visibility across search engines, social media, and advertising channels.
Its reporting tools for digital marketing enables marketers and agencies to create automated, client-ready reports that consolidate SEO, PPC, and social data in one place. With customizable templates, white-label branding, and scheduled delivery, Semrush Reporting turns raw marketing metrics into clear insights, saving time while improving the quality of reports being presented.
Key Features:
- Automated Report Builder: Quickly create branded reports using drag-and-drop widgets and templates.
- Cross-Channel Integration: Combine SEO, PPC, and social data from Semrush tools into one unified dashboard.
- White-Label & Custom Branding: Personalize reports with client logos, colors, and layouts.
- Scheduled Delivery: Automate report sharing with recurring email exports.
- Real-Time Updates: Keep stakeholders informed with always-synced, live performance metrics.
-
Ahrefs
What it is:
Ahrefs is an SEO and digital marketing platform trusted by professionals to analyze backlinks, track keywords, and improve website performance.
The Ahrefs Reporting Tool turns complex SEO and content data into easy-to-understand, visually rich-looking reports. It takes data from Site Explorer, Rank Tracker, and Site Audit to highlight growth and performance trends. It offers customization, automation, and export options for professional client reporting.
Key Features:
- Report Builder: Easily create and customize detailed SEO and backlink performance reports.
- Cross-Tool Integration: Combine data from Site Explorer, Rank Tracker, and Site Audit in one dashboard.
- Custom Branding: Add your logo, color themes, and personalized layouts for client-facing reports.
- Automated Scheduling: Generate and deliver recurring reports automatically via email.
- Portfolio Tracking: Monitor multiple domains or projects simultaneously for holistic performance insights.

-
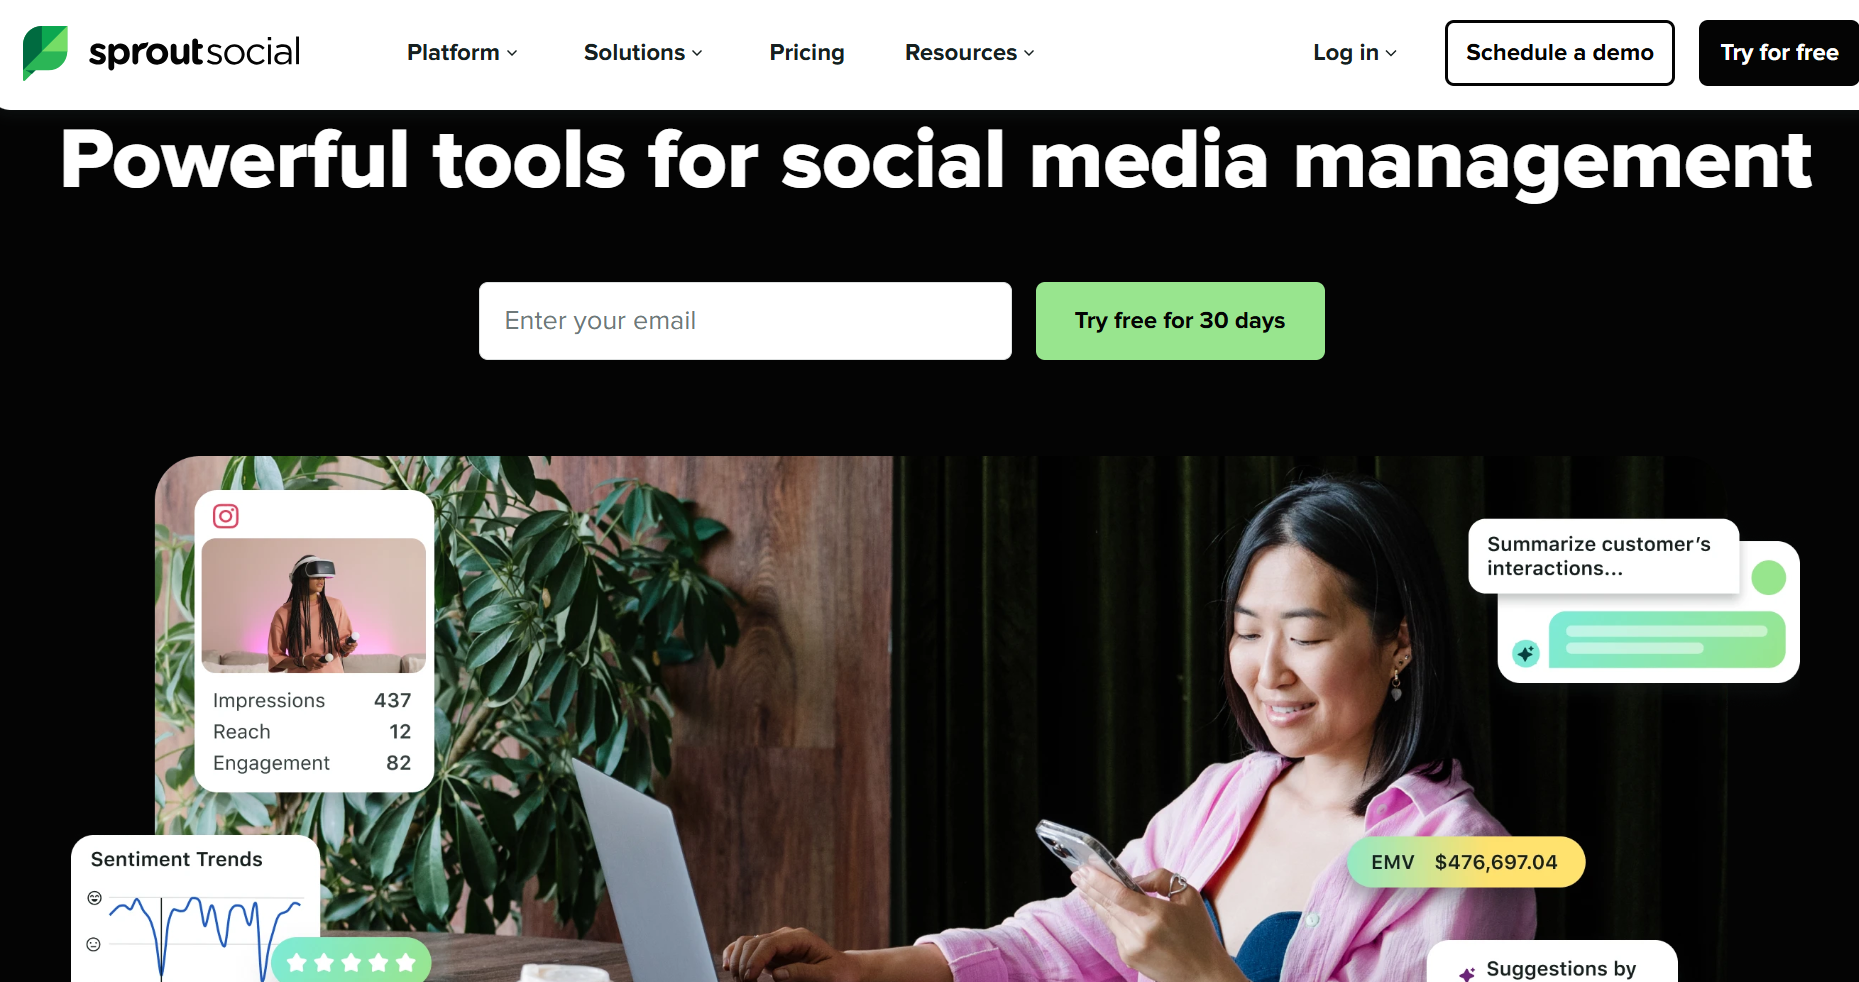
Sprout Social
What it is:
Sprout Social is a unified social media management and analytics platform that helps brands manage engagement, publish content, and track performance, all in one place.
Key Features:
- Smart Inbox: Manage all messages, mentions, and reviews from one unified inbox.
- ViralPost® Optimization: Automatically post content when engagement is highest.
- Advanced Analytics: Access detailed performance, audience, and competitor reports.
- Social Listening: Identify trends, sentiment, and conversation themes across platforms.
- AI-Powered Case Management: Convert customer queries into automated, trackable support cases.
-
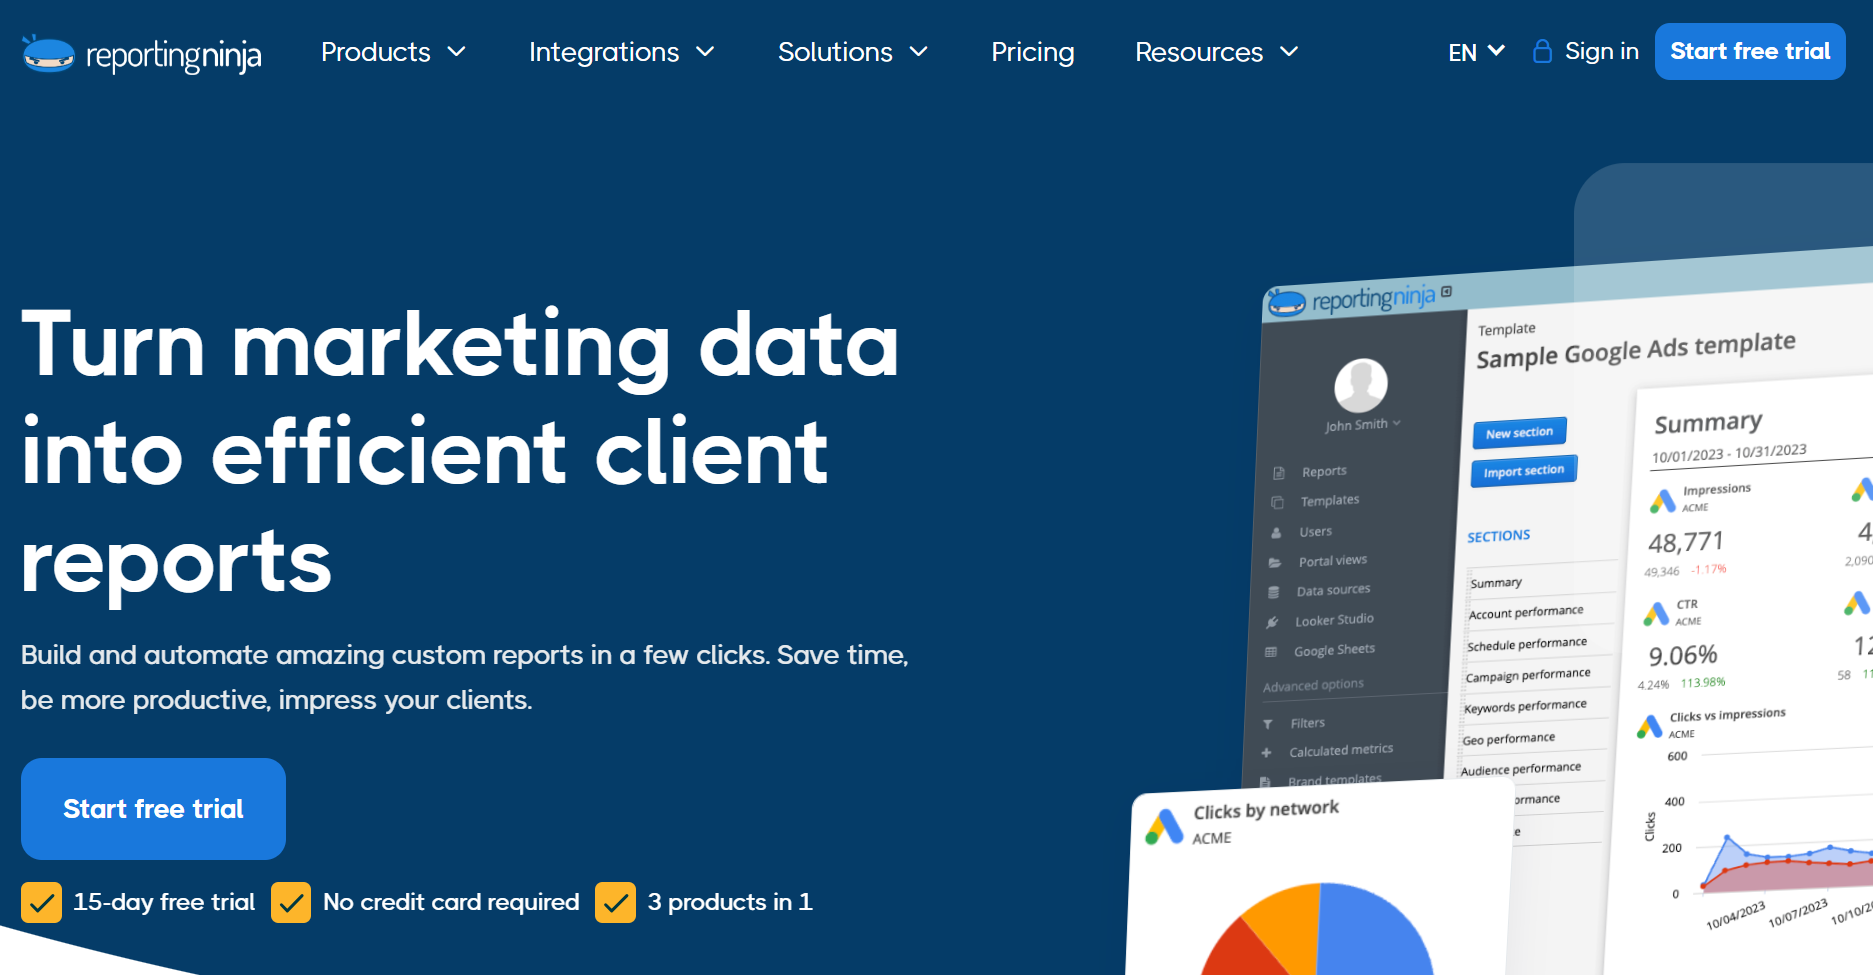
Reporting Ninja
What it is:
Reporting Ninja is a reporting tool for digital marketing and an automation platform that lets agencies create customized, client-ready reports by combining data from multiple platforms into one dashboard.
Key Features:
- Drag-and-Drop Report Builder: Create stunning reports instantly with a visual editor.
- Cross-Platform Reporting: Combine data from ads, social, and analytics tools in one view.
- White-Label Customization: Add your branding to reports and emails.
- Automated Scheduling: Generate and send reports on fixed intervals automatically.
- Client Portal Access: Give clients secure, 24/7 access to interactive reports.
-
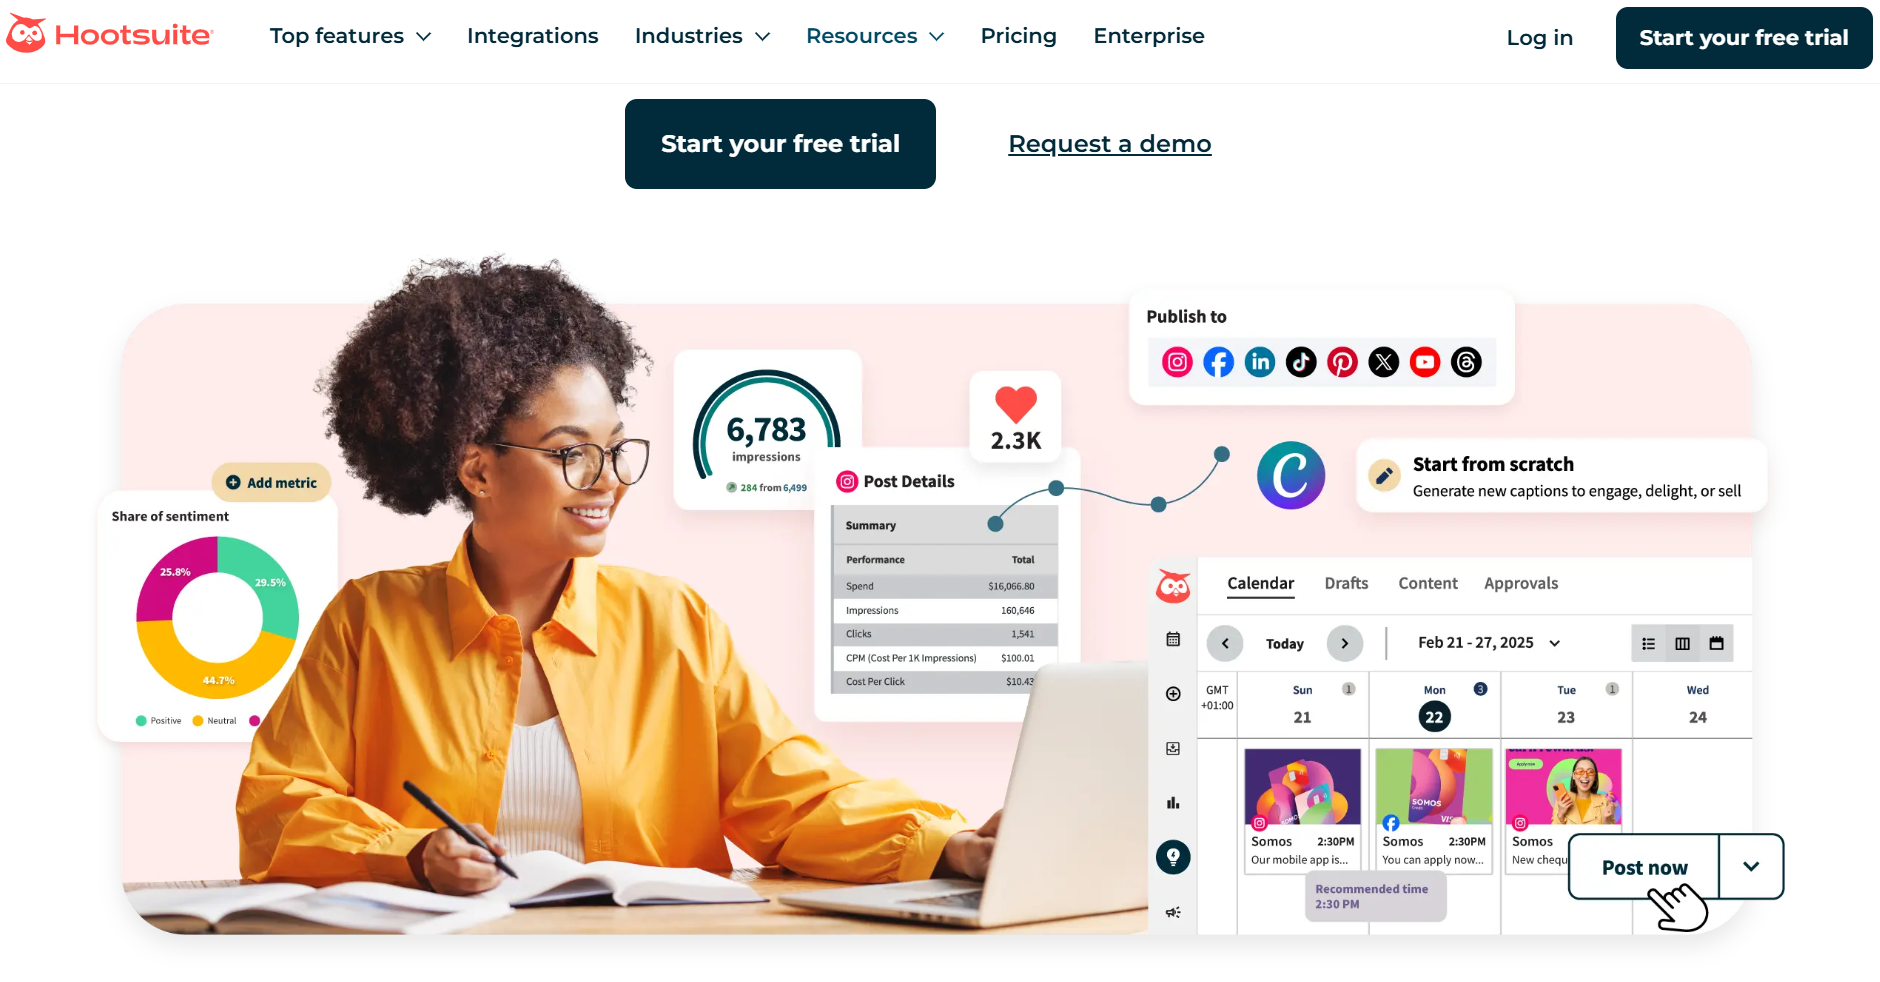
Hootsuite
What it is:
Hootsuite is a social media management platform that allows businesses to plan, publish, engage, and analyze information from across multiple networks efficiently, all from a single dashboard.
Key Features:
- OwlyGPT AI Assistant: Generates real-time content ideas and strategy recommendations.
- Unified Social Inbox: Manage all DMs and comments across networks in one hub.
- Post Scheduling & Automation: Plan and publish posts across channels with AI timing optimization.
- Trend & Sentiment Tracking: Discover trending topics and monitor brand reputation in real time.
- Employee Advocacy (Amplify): Empower employees to share branded content for expanded reach.
Why Should You Automate Digital Marketing Reports?
Manually collecting and compiling data from multiple platforms can be a time-consuming and error-prone process. Automating your digital marketing reports not only saves effort but also ensures accuracy, speed, and consistency, giving your team more time to focus on strategy instead of spreadsheets. Here’s why automation is essential for every marketing professional:
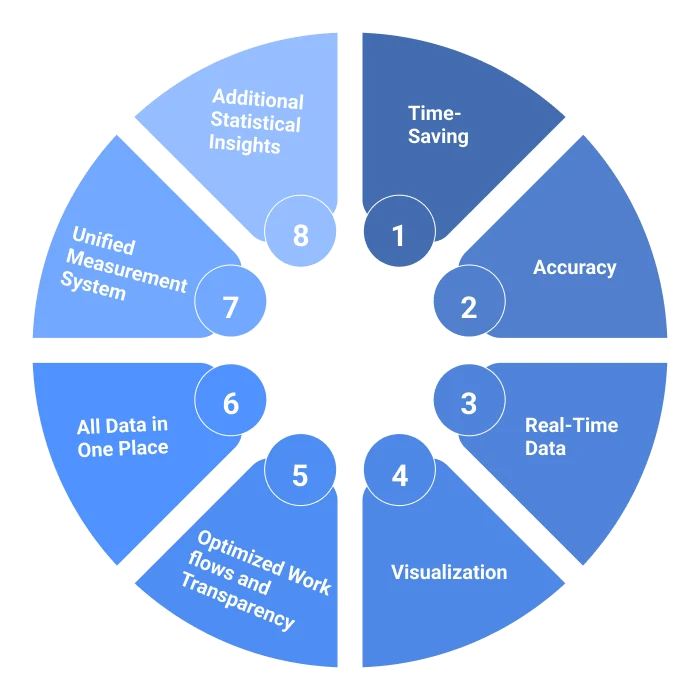
-

Time-Saving
Automation eliminates repetitive tasks like downloading CSV files or updating charts manually. With tools like ViewMetrics, your reports are updated automatically across all connected platforms. This means more time to analyze and act on insights, not gather them. Learn more about the benefits of creating marketing reports.
-

Accuracy
Human errors are common when data is pulled manually. Automated reporting ensures that every metric, from clicks to conversions, is sourced directly from verified platforms, maintaining data accuracy and consistency across all reports.
-

Real-Time Data
Automated reports refresh in real time, so your team always works with the latest numbers. Whether it’s a sudden campaign spike or a drop in engagement, you can respond immediately rather than waiting for the next reporting cycle.
-

Visualization
Automation tools don’t just deliver numbers; they present data visually through dashboards, charts, and infographics. This makes it easier to identify trends, understand performance at a glance, and communicate results clearly to clients or stakeholders.
-

Optimized Workflows and Transparency
Automated systems keep everyone on the same page. Teams can access shared dashboards, track campaign updates, and review performance in one centralized place, improving collaboration and maintaining full transparency.
-

All Data in One Place
Instead of switching between multiple platforms like Google Analytics, Meta Ads, and Mailchimp, automated tools centralize all data. A single, unified report gives a clear, complete view of performance across every channel.
-

Unified Measurement System
Automation brings standardization to reporting. Whether it’s engagement rate, CTR, or ROI, automated platforms apply consistent measurement criteria, making cross-channel comparisons accurate and easier to interpret.
-

Additional Statistical Insights
Many reporting tools use AI or machine learning to uncover deeper insights, such as performance forecasts, audience patterns, and anomaly detection. This helps marketers make smarter, data-driven decisions faster.
Automating your digital marketing reports is no longer just a convenience; it’s a necessity for efficiency, accuracy, and growth. By bringing all your marketing data together, automation helps you track performance in real time, eliminate manual errors, and uncover insights that truly drive results. Instead of spending hours compiling spreadsheets, you can focus on strategy, optimization, and achieving better ROI.
With tools like ViewMetrics, you can simplify reporting, visualize data beautifully, and keep every team member aligned — all in one place. Start automating your reports today and see how easy it is to turn complex marketing data into clear, actionable insights.
FAQ
-
What are the benefits of automating digital marketing reporting?
Automating your digital marketing reports saves hours of manual work by collecting and compiling data automatically. It reduces human errors, keeps your metrics up to date, and delivers real-time insights. This allows marketing teams to focus more on strategy and performance improvement while maintaining transparency with clients and stakeholders.
-
How do digital marketing reporting tools improve data accuracy?
These tools pull data directly from trusted platforms like Google Analytics, Meta Ads, and LinkedIn, eliminating the need for manual entry. Because updates happen automatically, your reports always reflect the latest and most accurate numbers, helping you make reliable, data-driven decisions.
-
Can I integrate multiple marketing channels into one reporting dashboard?
Yes! Most advanced reporting tools let you connect multiple channels, from SEO and social media to email marketing and paid ads. This integration creates a unified dashboard where you can monitor every campaign in one place, making performance tracking simpler and more efficient.
-
Are there tools suited for agencies as well as small businesses?
Absolutely. Many digital marketing reporting tools are designed to scale. Agencies can manage multiple client accounts with ease, while small businesses can track a few campaigns without overspending. Tools like ViewMetrics offer flexible plans to suit both use cases.
-
How quickly can I get actionable insights from automated marketing reports?
With automated reporting, you get near real-time access to campaign data and performance trends. This quick turnaround helps marketers react faster, whether that means adjusting ad budgets, refining targeting, or identifying top-performing content, ensuring every decision is backed by up-to-date insights.
Related Posts
-

Summary for the Blog Marketing analytics tools are crucial for data-driven decisions, optimizing ROI, understanding…
-

In today’s fast-paced digital world, tracking your social media performance is just as important as…
-

If you’re running a start-up, you know how difficult it can be to juggle marketing…
-

The pandemic has affected the way we market. This article will help you understand the…
-

Users visiting your website create a history of valuable data insights that you can use…